Does Your Proposal Process Make the Grade? 8 Ways to Measure Performance

A team that doesn’t track metrics is like a school without report cards. You can guess how you’re performing, but it’ll be hard to know if you’re earning a passing mark.
Research shows that this is the reality for the majority of proposal teams: Only 35% of teams track overall revenue won through a request for proposal (RFP). Only 28% track response speed. And even less (20%) track team performance metrics.
To help teams better assess their performance, we developed a new tool: The RFP Process Grader. Answer a few questions about your proposal process and the grader gives you a score based on industry benchmarks from 650+ other teams. Then, you’ll receive a custom report with personalized recommendations for improving your strategy. The best part? It only takes a couple of minutes to complete.
In this blog, you’ll learn about 8 of the industry benchmarks the grader uses to score your proposal process, and how they can help you measure performance. Plus, we share tactical tips for calculating these metrics, as well as advice for leveling up your proposal development process.
What Makes a Good Proposal Process? Check Out These Benchmarks
- Participation: Companies Respond to 65% of RFPs
- Win Rate: RFP Teams Win 47% of Bids
- Collaborators: 9 People Participate in an Average RFP Response
- Turnaround Time: Most RFPs are Turned Around in 2 Days
- Writing Time: RFP Teams Spend 23 Hours on Each Response
- Software Usage: Teams Using RFP Tools Respond to 163 Proposals Annually
- Team Performance & Sentiment: Top Teams Track Qualitative Metrics
- RFP Quality: 46% of Teams Report Satisfaction with Responses

1. Participation Rate: Companies Respond to 65% of the RFPs They Receive
Not all proposals are created equal. In fact, research from Loopio’s 2021 RFP Response Benchmarks & Trends report shows that organizations respond to just 65% of the total RFPs they receive on average. This is not surprising, considering that any response takes up precious time, resources, and collective energy.
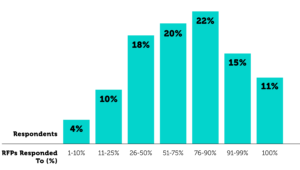
RFP Participation Rate (% Responded to) | Loopio 2021 RFP Trends Report
✓ How to measure: To calculate your participation rate, start by identifying how many proposals you respond to each year. Then, multiply that by 100 and divide by the number of RFPs you actually received. (For example: if I respond to 75 proposals annually, but receive 150 RFPs in total, my participation is 50%).
✓ How to improve: If you’re participating in less proposals than the average team (65%), it could be a sign that you’re not attracting RFPs that are a good match for your business. Or, if you’re responding to more RFPs than your peers, it can indicate that your RFP evaluation criteria isn’t strict enough.
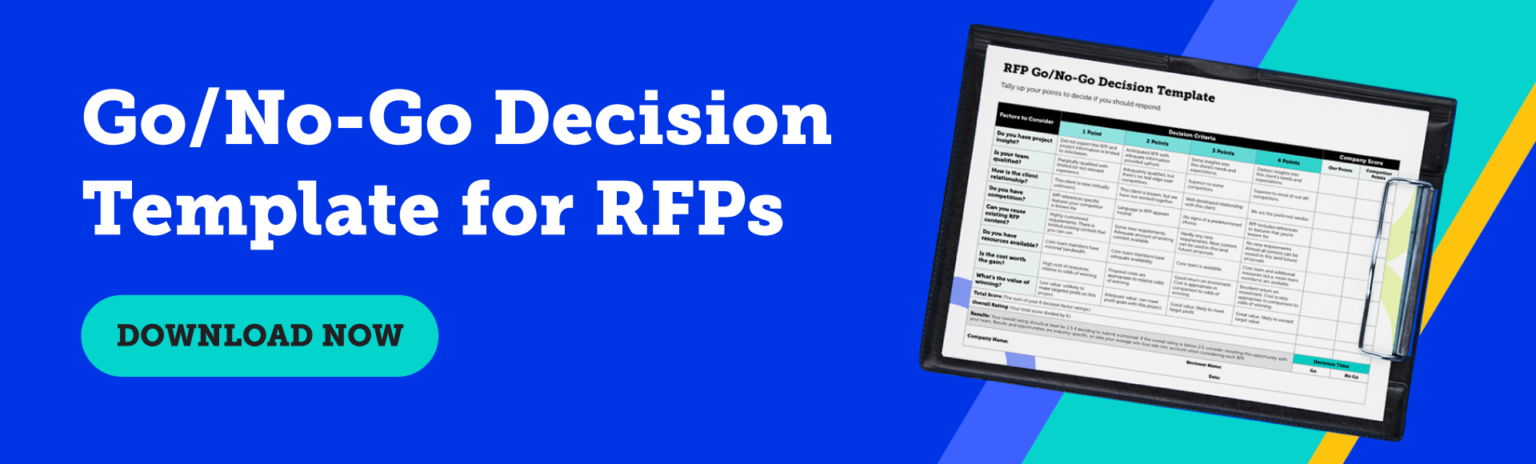
Either way, use a consistent framework to decide which RFPs to take on. Tracking advanced RFP metrics like cost per bid helps make more informed decisions about which proposals provide a return on investment. Or, if you’re just starting out, try using Loopio’s free template: Go/No-Go decision framework as a starting point for your next bid.
2. Win Rate: Companies Win 47% of RFPs on Average
Win rates represent how successful your company is at closing deals that involve an RFP. The average RFP win rate is 47%—although they do vary by industry or company size.
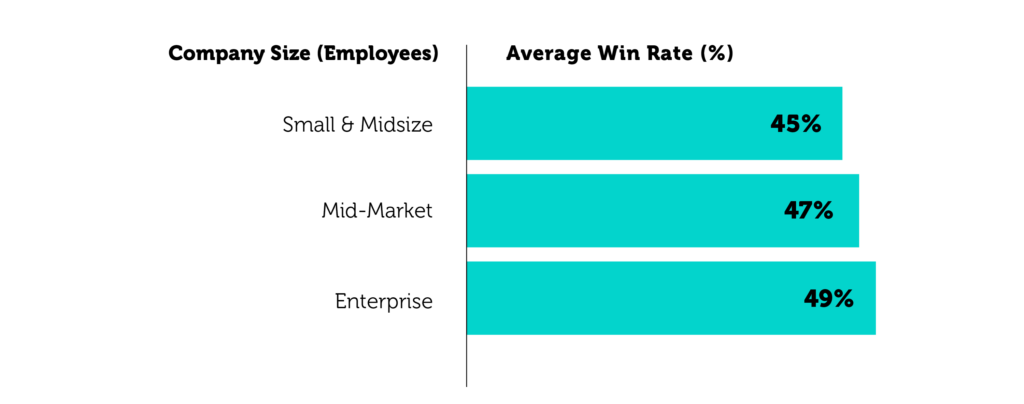
Win Rate by Company Size | Loopio 2021 RFP Trends Report
While win rates aren’t the only metric that matters, they’re helpful to track as an indicator of your response team’s success, as well as your organization’s competitiveness in the market.
✓ How to measure: To calculate your win rate, identify the number of RFPs won this year. If your company uses a customer relationship management (CRM) tool to capture sales information, try running a report on closed-won opportunities. (Be sure to capture ‘won,’ ‘lost’ and ‘undecided’ as your categories. This way, you can leave undecided bids out of your calculation for accuracy.)
Next, multiply the number of ‘closed won’ RFPs by 100 and divide by your total number of responses. (For example: if I won 30 RFPs last year, but responded to 75 proposals overall, my win rate would be 40%)
✓ How to improve: To forecast RFP revenue more accurately, regularly review your win rates. To select a time interval for reviews, consider how long your average sales cycle is. If your average deal closes in three months, review your win rates quarterly to better understand key trends.
Whether you’re winning more or less than average, debrief with your sales team to understand if quality, competitors, or relevancy of bids is the key issue on your last few losing RFPs. Or, try undertaking a more advanced approach by triggering win-loss surveys in Salesforce, like the team at Qualtrics.
3. Collaborators: 9 People Participate in the Average RFP Response
The average number of participants is 9 people (varied by industry). And you may be surprised to find out that the more people involved in an RFP, the better.
According to research, teams that involve more contributors are more likely to have higher win rates. This is likely because more people means more insights from across an organization, which is why it’s an interesting metric for tracking success.
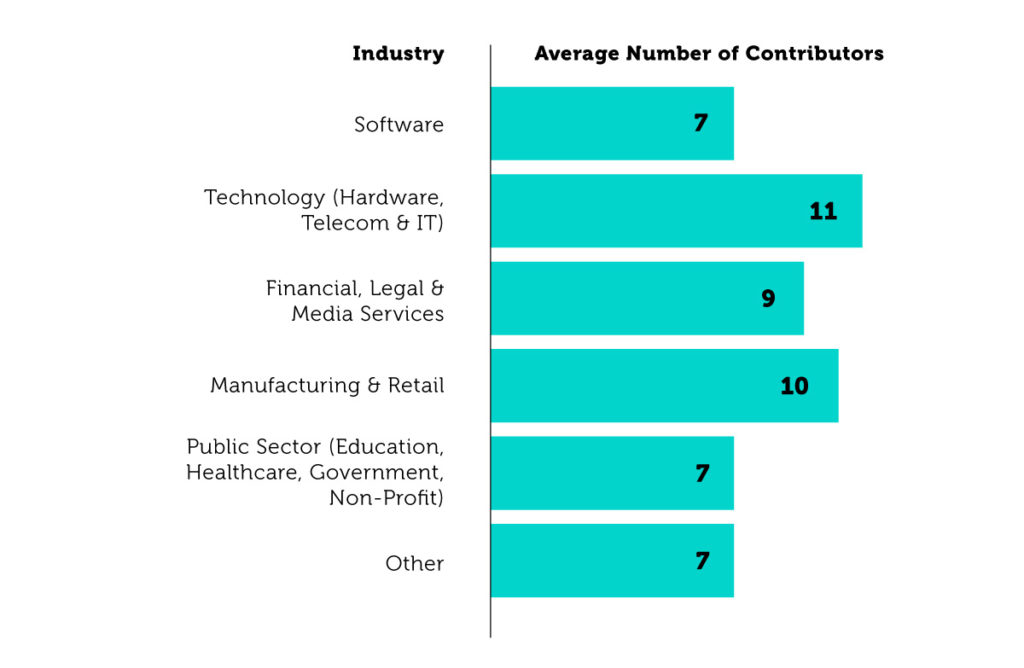
RFP Contributors by Industry | Loopio 2021 RFP Trends Report
✓ How to measure: Count how many contributors are typically involved in your RFPs—and don’t forget to include subject matter experts like legal and compliance team members. Some more complex documents may require more reviewers than usual, so be sure to calculate the average number of contributors across all proposals.
For proposal managers using RFP software, you should be able to count the number of participants assigned to each Project. Is your total more or less than other organizations of your company’s size?
✓ How to improve: If you involve more contributors than average, your collaboration efforts may actually be slowing down your response speed. Consider how you can cut back (without affecting proposal quality). Or, if you’d like to involve more people, be sure to craft clearly defined roles for each contributor so buy-in goes smoothly and expectations are clear.
4. Turnaround Time: Most RFPs Are Complete in Less Than 2 Days
Teams who spend more time on proposals tend to have the highest win rates (likely because customized answers make a good impression).
But according to RFP statistics, the majority of teams are turning around proposals in 48 hours or less. 😱 This is shockingly speedy, considering the average RFP involves 9 people.
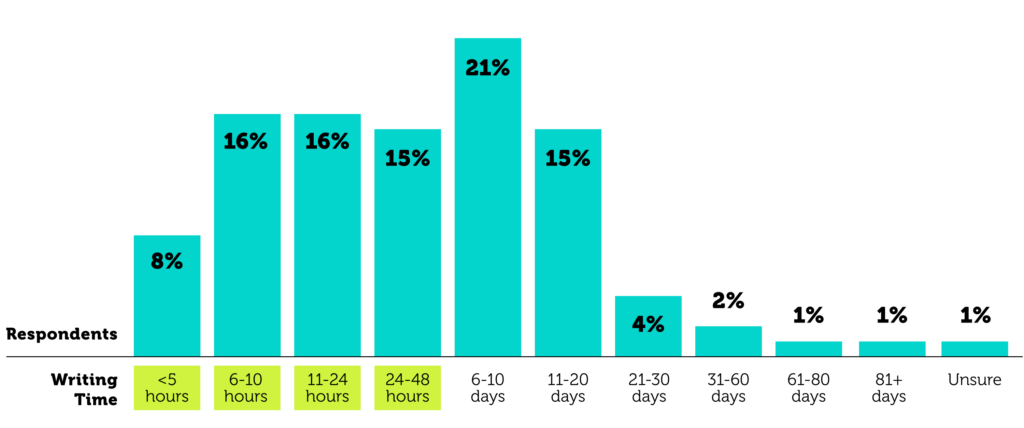
RFP Timeline | Loopio 2021 RFP Trends Report
✓ How to measure: Look back at your RFP timelines over the past month. From the moment you receive an RFP, to the time you submit—how long does it take your team to turn around a proposal response?
If you’re using RFP software, track through your overall project timelines. You could also monitor by adding fields to your customer relationship management (CRM) tool, which captures an RFP’s start date and submission date. Or, Google sheets will do in a pinch.
✓ How to improve: If you submit RFPs faster than the average team, but your win rate is where you want it to be, don’t change a thing. However, if it’s lower than desired, ask your team members to allocate more time to support the proposal process. Whether it’s an extra proofread or review of content, more eyes can be better for response quality.
5. Writing Time: RFP Teams Spend 23 Hours Crafting Answers
On average, teams dedicate an average of 23 hours writing every RFP response. This may sound like a lot, but research shows more writing positively impacts your likelihood of winning. Top performing teams actually spend 2 extra hours on average writing answers.
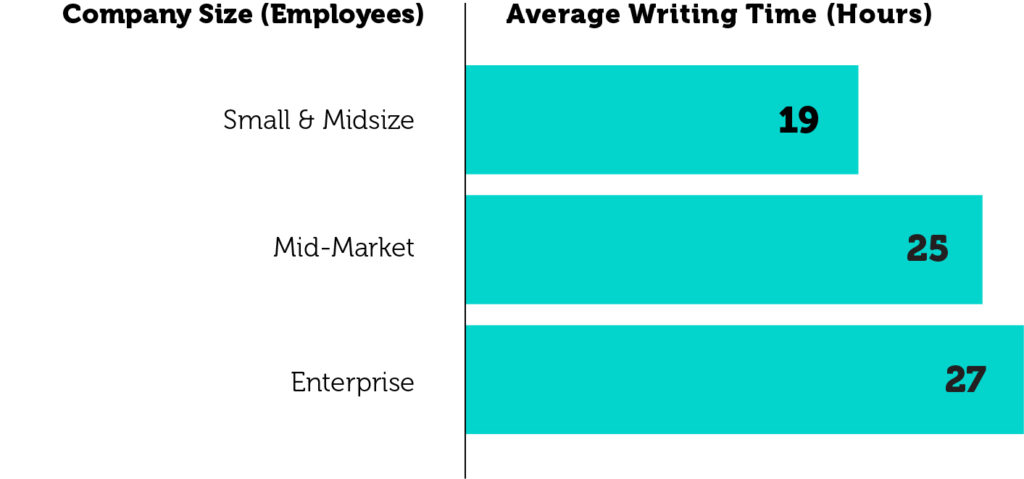
Time Spent Writing an RFP Response | Loopio 2021 RFP Trends Report
✓ How to measure: Looking back at your own team’s proposal process, how much time do you dedicate to filling in answers? Use a time-tracking app like Everhour to more accurately estimate how many hours are spent on writing answers in each response. (You can even sync it to other tools like Jira or Asana.)
✓ How to improve: According to Grant Waldron, Proposal Manager at Fastly, writing time is best spent harnessing RFP automation to take care of the tedious tasks (like copy-and-pasting content you’ve answered before) so you can focus on more strategic efforts, like customizing responses for each client.
One strategy to consider: Identify which content is used the most through your RFP tool. Are you frequently scored lower by procurement teams on any of these commonly-used answers? Proposal managers should prioritize improving this content, as this will have the biggest impact on your writing quality.
6. Software Usage: Teams Using RFP Tools Respond to 163 Proposals Annually, More Efficient Overall
Teams using RFP software submit a higher volume of proposals annually—163 RFPs in total, which is 43 more proposals annually than their counterparts.
But measuring the benefits of software isn’t all about the volume of bids. Other reported benefits include: More manageable stress levels, an efficient proposal process, and feeling recognized by team members for your work.
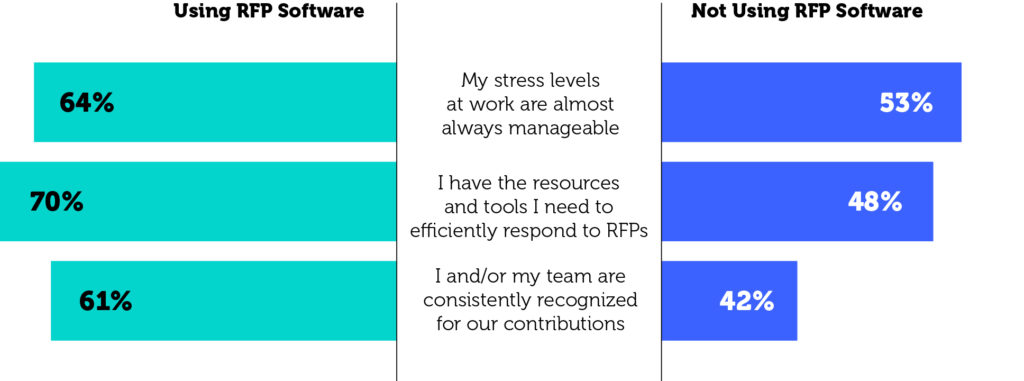
Software User Sentiment | Loopio 2021 RFP Trends Report
✓ How to measure: To understand if you’re getting the most out of your RFP platform, keep an eye on key metrics that impact team efficiency, like reused content answers and the number of contributors using the system. Monitoring these on an ongoing basis will give you a sense of trends among your own team. You should also track the overall volume of projects being done in the platform and measure that against team capacity—which brings us to our next point…
✓ How to improve: If you’re currently measuring RFP volume using software, take your insights to the next level by matching against team capacity using Salesforce dashboards. Your dashboards should include: how many RFPs your team can take on this week, next week, this month, and this year. It’ll help provide visibility across the company on team bandwidth and help you advocate for more resources if needed.
7. Employee Performance & Sentiment: Top Teams Track Qualitative Metrics
While the majority of teams track success through quantitative metrics—like revenue won from RFPs—research shows that top teams (those who win 51% or more of their bids) are most likely to track qualitative RFP metrics, including employee performance and satisfaction.
Teams that report higher satisfaction with their proposal process (unsurprisingly) have better win rates. So, tracking team sentiment around efficiency can help you figure out if something in your process needs to be addressed.
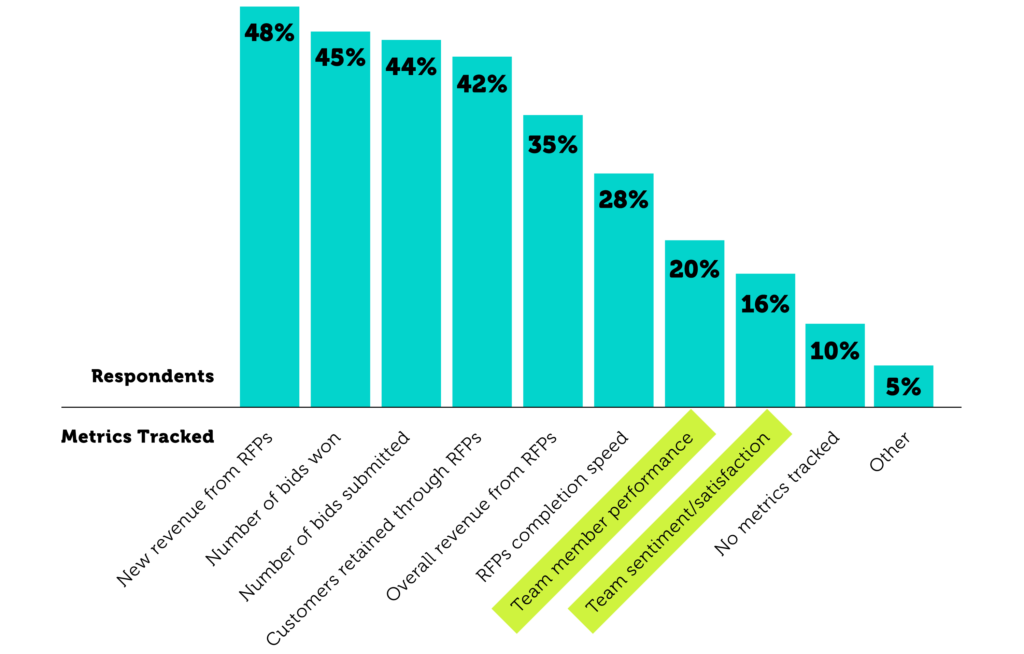
RFP Metrics Tracked | Loopio 2021 RFP Trends Report
✓ How to measure: If you’re not already tracking employee satisfaction, now is the time to start. It’s as easy as asking the four questions below after each RFP response is complete:
- Which department are you in?
- How much time did you spend on this RFP?
- What would you change about this proposal process?
- Please rate your experience on a scale of 1 to 5
✓ How to improve: No matter where your team falls on the tracking spectrum, share this data with company leaders so you can improve. Then, go over the results of the survey quarterly. Regularly reviewing metrics together can help reduce friction in making the best decisions to improve your proposal process and, ultimately, win more bids.
Don’t forget to track satisfaction outside of your team, too. Be sure to include sales reps, legal, or any other subject matter experts (SMEs) involved in the proposal process.
8. RFP Quality: 46% of Teams Are Satisfied With Their Responses
Measuring overall proposal quality can be tricky, since it’s subjective. However, teams with higher win rates are more likely to be ‘Very Satisfied’ with their proposal quality than those with lower win rate. So, tracking proposal quality is extremely valuable for RFP responders who want to drive revenue.
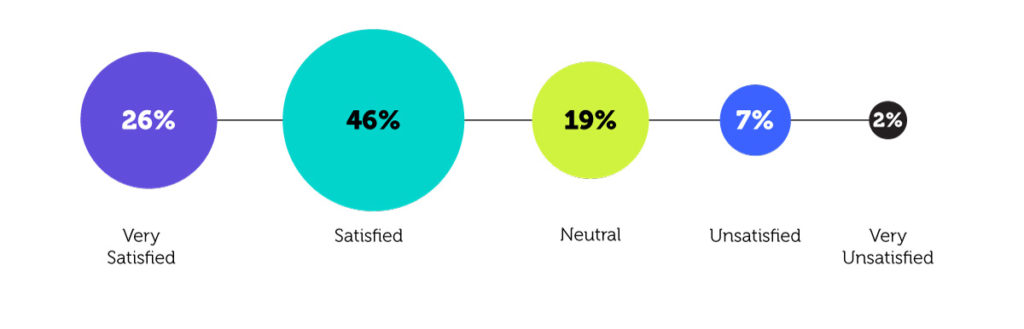
Satisfaction with RFP Quality | Loopio 2021 RFP Trends Report
✓ How to measure: Meet with your team to gather feedback on your response quality. In particular, ask your contributors to answer the questions below on a scale of 1 to 5:
- How would you rank the clarity of your answers?
- How would you rank the level of customization you can provide for each proposal?
- How would you rank your proposal’s overall cohesion?
- How would you rank the quality of insights from subject matter experts?
✓ How to improve: Any tools that help you save time on manual tasks, like formatting documents and searching for answers, will give you back bandwidth that you can put towards improving proposal content quality (which ultimately improves the proposal process). Consider looking into RFP tools that can help you automate tedious, low-value tasks more efficiently. You can often use these same tools to capture which bids you’ve won so you can see the impact automation is having on your proposals.