Average RFP Win Rates & More: 38 Proposal Statistics to Know in 2026

- Average RFP Win Rate and Revenue
- RFP Team Size and Challenges
- RFP Response Timelines
- Submission and Volume Benchmarks
- RFP Software and AI Usage
- 2026 RFP Resources and Predictions
Every RFP team wonders: Are we responding to enough RFPs? Are we investing in the right areas? How does our win rate stack up in our industry?
With tight deadlines, limited resources, and growing expectations from the C-suite, maintaining peak performance is no small feat. To stay competitive, you need to know where you stand and what’s working for other teams.
That’s where Loopio’s seventh annual RFP Response Trends & Benchmarks Report comes in. It analyzes data from 1,500+ teams worldwide to uncover key insights on the state of response management, reveal the biggest challenges teams are facing, and examine the tools helping them win more business.
Whether you’re looking to boost efficiency, secure more resources, or improve your win rate, these 38 must-know RFP statistics will give you the insights you need to stay ahead in 2025.
Want more insights on the state of RFPs in 2026? Download the full report.
Average RFP Win Rates and Revenue
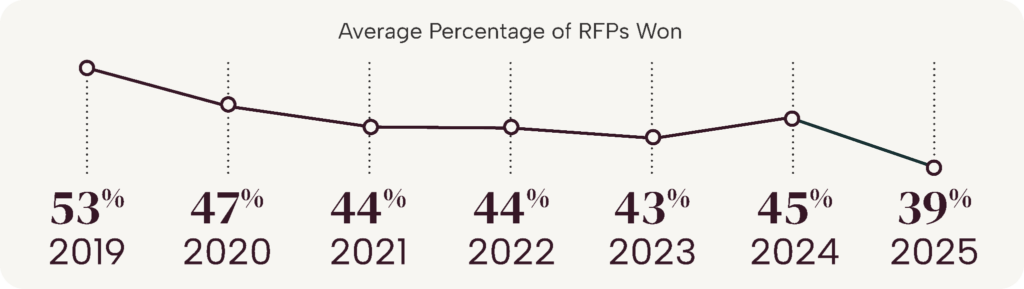
1. RFP win rate statistics: The average is 45%.
What’s a strong proposal win rate? On average, teams win 39% of their RFPs—but this figure doesn’t reflect the success seen in recent years. Looking at performance data from 2019 to 2026, the average RFP win rate is 45%, which is a more competitive benchmark for teams aiming to lead the market.
If you’re curious about the average RFP win rate in your industry, download the 2026 RFP Response Trends and Benchmarks Report.
2. UK teams achieve the highest RFP win rates globally (again).
The UK remains the global frontrunner with a 47% win rate, a position they’ve held over the past few years. While North America and Europe showed signs of closing that gap, both regions lost ground this year, with win rates dipping to 37% and 39%, respectively.
3. The average RFP advancement rate is 46%.
Advancement rates are somewhat rosier than the average RFP win rate. On average, companies progressed to the shortlist 46% of the time, but just like win rates, this figure also saw a significant drop from 54% last year.
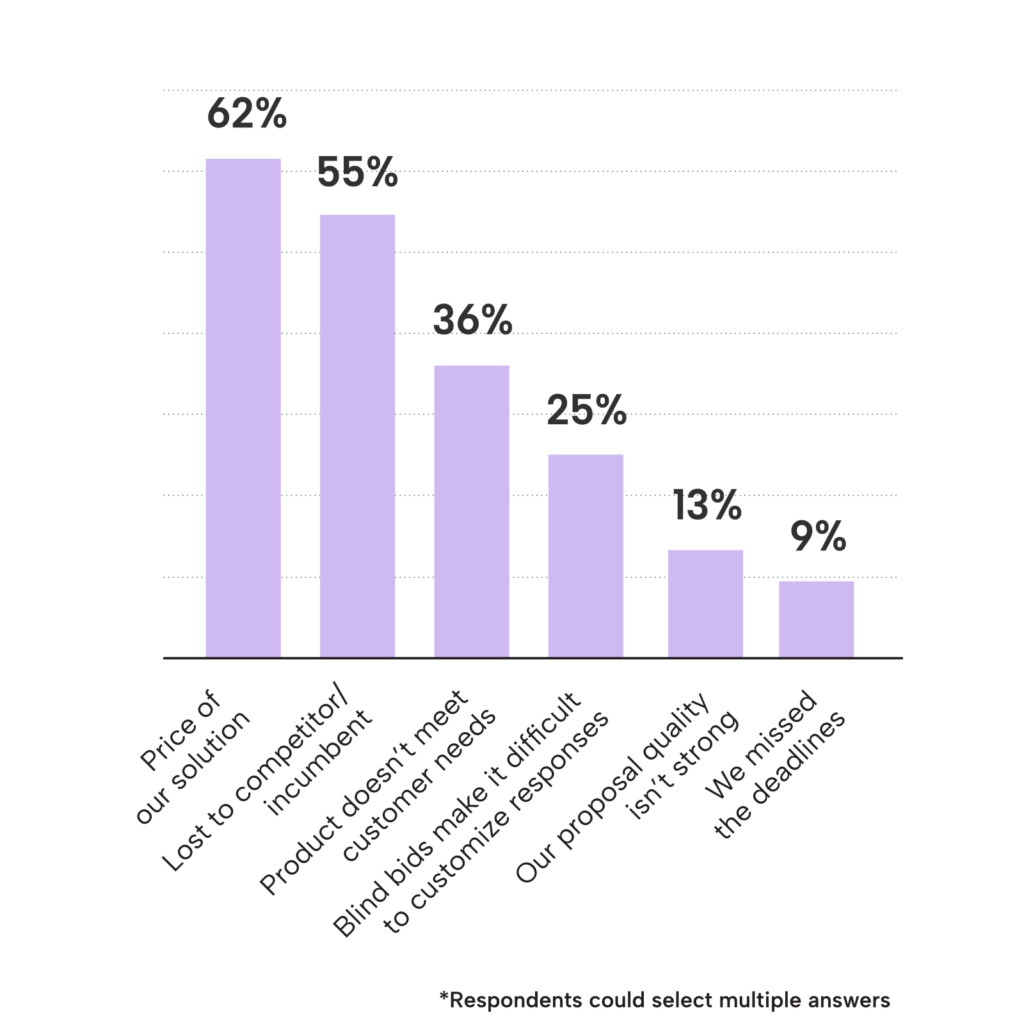
4. The top reason for losing a bid? It comes down to “price” and “competition.”
Since 2021, price has remained the primary reason for bid losses. However, other factors are beginning to shift. While competition tied with price at 61% last year, that figure has since cooled to 55%. Only 13% of teams attribute losses to proposal quality—a sign that teams are confident in their responses.
5. There’s still a difference in perspective on bid losses between roles.
There’s a widening gap between how junior and senior employees perceive lost deals. Associates are still more likely to blame price (68%) and competition (65%), while directors and executives are more likely to point to the product as the key issue.
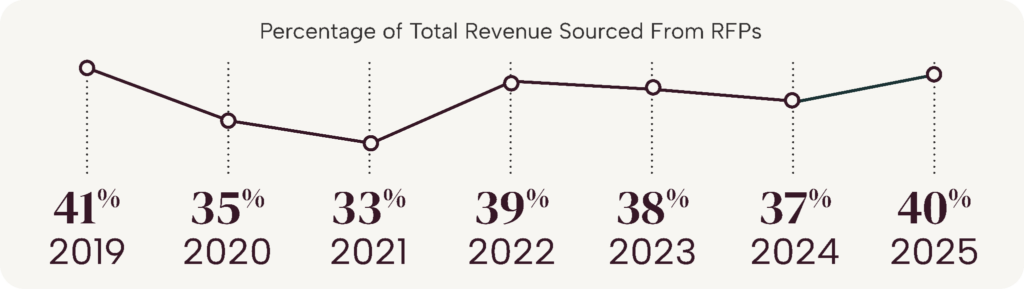
6. Annual revenue from RFPs is $256 million.
Despite a significant decrease in average RFP revenue (falling from $256M to $129M), the relative impact of proposals hasn’t budged. RFPs continue to influence between 30% and 40% of total revenue, a benchmark that has remained remarkably consistent since 2019. This highlights the industry’s resilience: even as deal sizes fluctuate or budgets tighten, RFP teams continue to deliver a massive, reliable portion of the company’s total earnings.
7. The healthcare industry generates the most revenue from RFPs.
RFPs bring in an average of $129 million annually for organizations. But the healthcare industry remains in a league of its own—generating $559 million in RFP deals. While that’s a dominant figure, it represents a near 50% drop from last year’s $1.05 billion peak. This suggests that even healthcare—a traditional powerhouse—is feeling the pressure of the economy.
8. More teams are tracking key RFP metrics beyond win rate.
While 95% of teams track success metrics, most focus on win rates and submission volumes. In contrast, top performers (those winning 50% or more of their bids) take a more granular approach. By tracking metrics like revenue influence, completion speed, and team performance, these leaders prove that the secret to a higher win rate lies in the details other teams overlook.
How Do You Win More RFPs? Insights from Top Performers
Top performers are defined as teams that win more than 50% of their RFP submissions. What’s their secret to high win rates?
Here’s what they do differently:
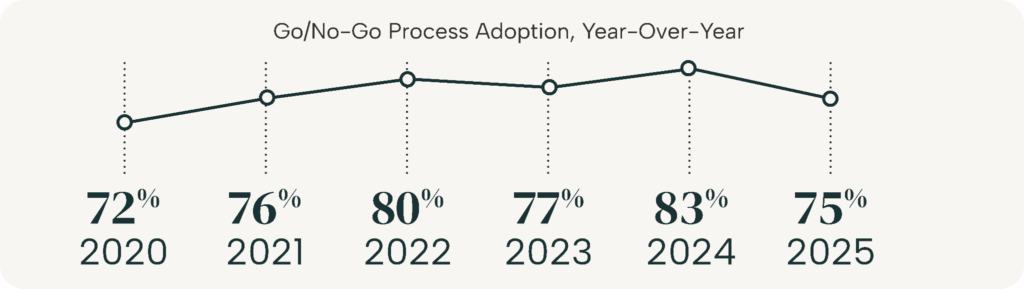
They’re selective about RFPs: 81% of top performers use a go/no-go decision process, compared to the 75% average. This shows that being choosy helps you focus on high-probability deals (and take them over the finish line.)
They use software and AI deliberately: Strategy—not technology—is the new differentiator. While tech adoption is almost universal, top performers stand out by using it for high-impact tasks: analyzing proposal quality, verifying accuracy, and interpreting data.
They submit more RFPs without burning out: Top performers submit an incredible 180 bids annually by focusing on efficiency over effort. By refining their workflows, these teams have found a way to scale their output without compromising their well-being.
This is just a sneak peek into the winning habits of top performers. For the full list, check out the final chapter of the 2026 Report.
RFP Team Size and Challenges
9. More teams have a dedicated proposal manager leading the RFP process.
Having a dedicated proposal manager has become the standard across industries–signalling that companies are prioritizing specialized expertise to navigate an increasingly competitive bidding landscape.
Insurance has led this charge more than any other sector, with RFP process ownership skyrocketing from 47% to 76%.
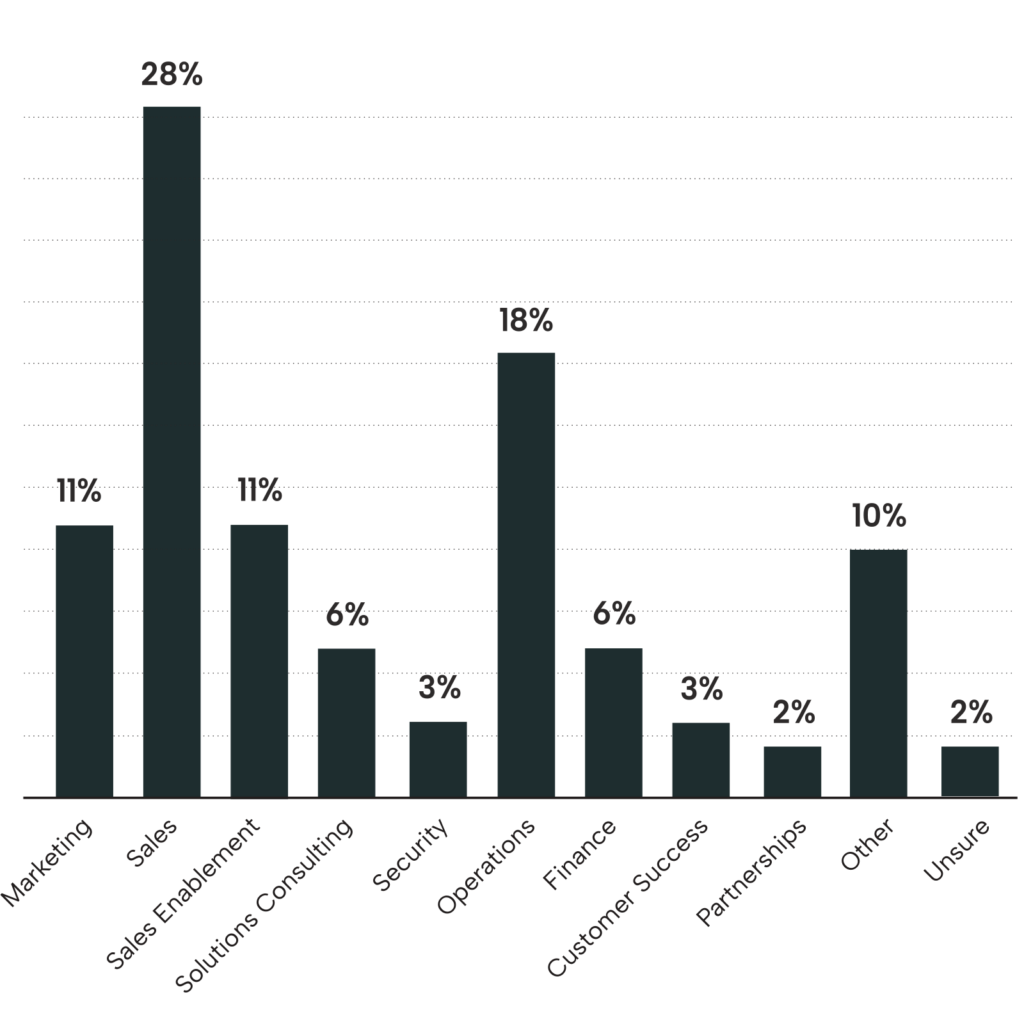
10. Proposal teams continue reporting to sales, but it’s shifting.
While Sales (including Enablement and Solutions Consulting) still houses 43% of proposal teams, Operations is gaining significant ground. This year marked a 10-point increase in teams reporting to Operations, reflecting a growing emphasis on operational efficiency in the bidding process.
11. For the fifth year in a row, the average RFP team size is 8 people.
The average RFP team size has held steady—but beneath the surface, shifts are happening. Growth in Technology and Consulting is being balanced by downsizing in Insurance, Healthcare, and Retail. Meanwhile, Software has maintained its headcount, signalling that proposal teams remain a protected asset despite broader market volatility.
12. Every RFP involves an average of 9 contributors to complete.
On average, nine people contribute to each RFP—a number that has remained steady since 2021. Most teams involve between 6 and 15 contributors, which is about the same as last year.
13. Enterprise teams are getting smaller.
The organizational gap is shrinking: Enterprise teams have downsized to 12 members, while SMBs remained consistent at four. Notably, Mid-market headcount has leveled off at 9 members after a 2024 jump, signaling that they may have identified the baseline needed to support their RFP operations.
14. Teams feel more satisfied with their RFP process, but not when it comes to win rates.
Process satisfaction continues its upward trend, reaching 67% this year—a slight climb from 64% in 2024. However, a clear disconnect has emerged: while teams are increasingly confident in the quality of their submissions, that sentiment doesn’t extend to their outcomes. Given the dip in win rates, it’s no surprise that satisfaction regarding advancement and conversion is lower.
15. 1 in 10 teams feel unmanageable stress.
Just 1 in 10 teams report unmanageable stress levels, even as submission volumes climb (more on that below). While some pressure is unavoidable in the fast-paced world of RFPs, most teams feel capable of managing the load.
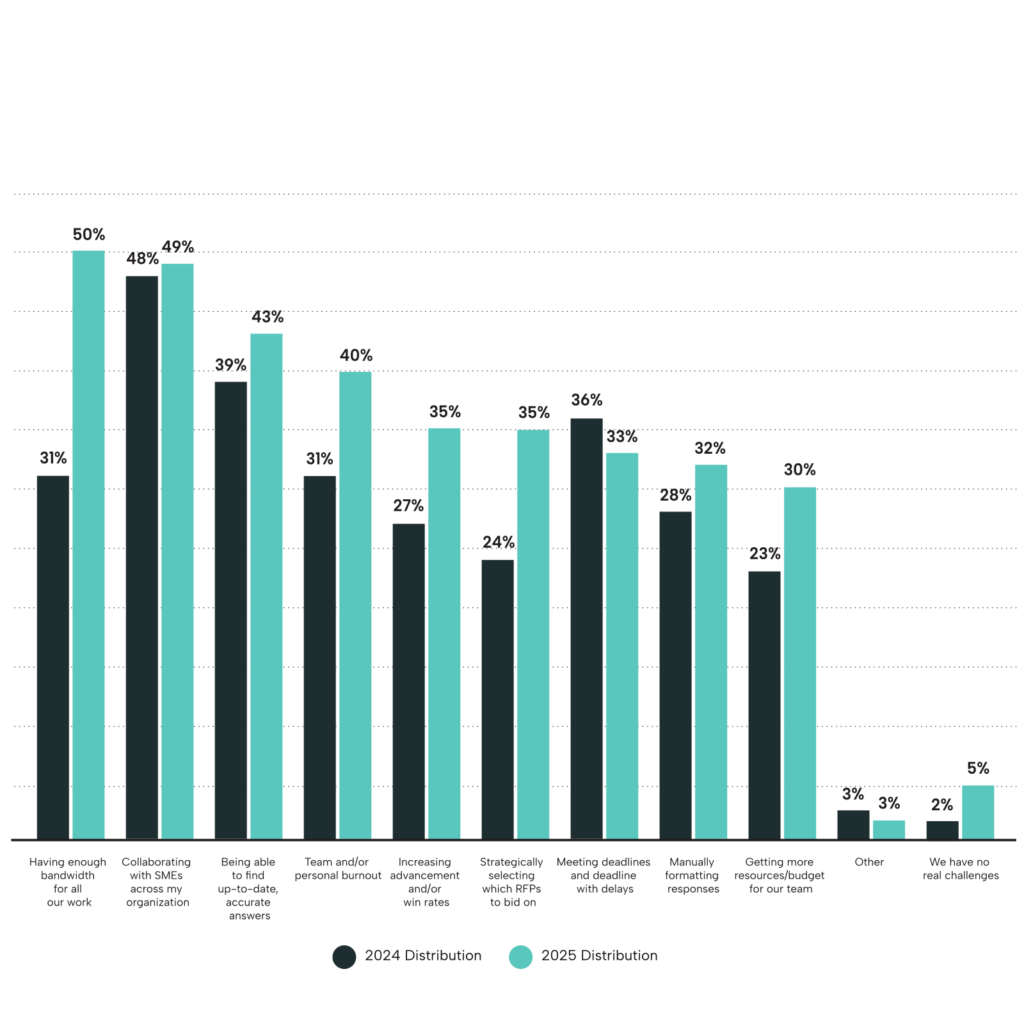
16. Bandwidth takes the top spot as the #1 challenge among teams.
For the first time in five years, bandwidth has overtaken SME collaboration as the #1 challenge for RFP teams. This isn’t a subtle shift; it’s a 20-point surge that reflects a growing crisis: teams are significantly increasing their submission volumes without a corresponding increase in headcount. This ‘more with less’ pressure is causing a ripple effect, making it harder to find up-to-date answers, select bids strategically, and protect teams from burnout.
17. Less than half of teams gained new resources in 2025.
The pace of resource acquisition cooled slightly this year, with 46% of teams gaining new headcount, budget, or software—down from 52% in 2025. However, stability is the secondary story: 33% of teams maintained their existing resources. This suggests that while growth continues for just under half of teams, one-third of the market has reached a baseline, and may be shifting focus from expansion to optimization.
20. More than half of teams gained new resources in 2024.
Over half (52%) of respondents reported gaining new resources—whether headcount, budget, or software—a sharp increase from 34% the year before.
RFP Response Timelines
18. The average time to respond to a single RFP has sped up.
Teams now spend 33 hours per RFP, down from 35 last year. This slight efficiency gain reflects the growing impact of AI, but it also signals a shift in priorities. Rather than simply finishing faster, teams appear to be using those reclaimed hours to sharpen their proposals and meet rising expectations.
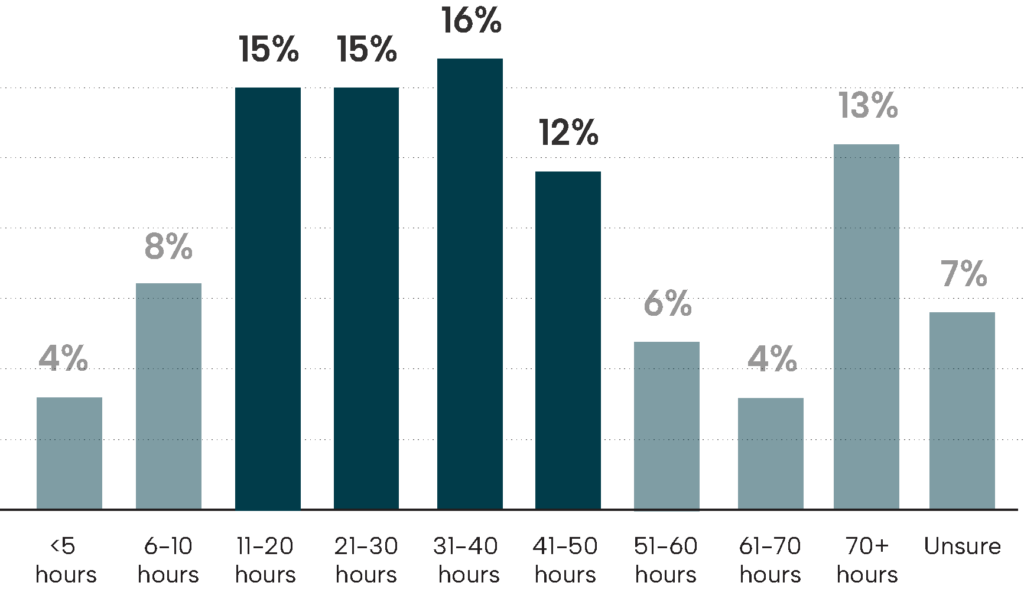
19. SMBs come in first for the fastest RFP response times.
As in previous years, SMB and mid-market RFP teams spend the least amount of time responding to RFPs—averaging 27 and 33 hours respectively. While efficiency is important, it’s crucial to balance speed with quality to maximize your chances of winning the bid. The data shows that enterprise companies spend 39 hours per RFP response–and boast higher win rates because of it.
20. Proposal teams spend the most time on RFP responses.
While the global average is 33 hours, dedicated proposal teams spend 36 hours per RFP response—significantly more than Sales or Security counterparts. This extra time is a strategic choice: while other departments must juggle RFPs alongside their core duties, proposal teams provide the exclusive focus required to meet today’s high-quality standards in a competitive market.
21. Longer RFP response time still leads to higher win rates.
Winning teams prioritize substance over pure speed. By spending 35 hours per submission (compared to the 33-hour average), they ensure their proposals are personalized and polished. This extra two hours seems to be the differentiator in competitive bids, and it’s a luxury afforded by their larger headcounts, allowing for high-impact work without sacrificing total output.
For more insights on average RFP response timelines, download the full Response Trends & Benchmarks Report.
RFP Volume and Submission Benchmarks
22. On average, organizations submit 166 RFPs annually.
Organizations now respond to an average of 166 RFPs per year, a big jump from 153 last year. Breaking it down further, nearly half of teams have responded to more RFPs, and about a third are responding to the same number of requests. This escalated volume explains why bandwidth has become the top challenge.
23. Only 12% of teams submit more than 500 RFPs per year.
RFP submission volume varies widely across organizations, but high-volume teams are the exception, not the rule. Only 12% of teams submit more than 500 RFPs annually, while the majority fall within the 51-250 range.
24. Management consulting submits the most RFPs annually.
For the first time, Management Consulting has unseated Insurance as the industry leader for annual RFP submissions. This marks a significant disruption of the big three—Insurance, Advertising, and Financial Services—which have historically dominated the top spots. The surge in Consulting proves that RFPs have become critical for growth in the professional services sector.
25. Enterprise companies submit 3.3x more RFPs than SMBs.
RFP volume is rising, with organizations adding 9–13 more proposals to their workload this year. While enterprise volume remains the highest, the growth is consistent for everyone: SMBs (79), mid-market (164), and enterprise (260). No matter the company size, the pressure to bid is mounting.
26. Organizations typically respond to over half of the RFPs they receive.
On average, organizations respond to 55% of the RFPs their company receives—meaning most teams deem half of bids worth answering. This is a drop from last year when the participating rate was 63%, an encouraging sign that teams are choosier about which proposals they take on in general.
27. 75% of teams use a go/no-go process for RFPs, a drop from last year.
Qualification appears to be taking a backseat to sheer volume. This year, sticking to go/no-go decision criteria dropped to 75%—an 8-point decrease from 2024. This decline suggests that teams are bypassing formal evaluation to keep pace with mounting submission pressures, favoring quantity over strategic alignment.
28. Teams with an RFP tool submit 10 more RFPs annually.
Teams equipped with RFP response automation software outpace the average by 10 additional submissions per year, reaching an annual average of 176. More importantly, this increased output hasn’t come at the cost of well-being: 37% of software users report that their stress is ‘almost always manageable.’ This demonstrates that the right tech stack can help teams handle higher volumes without burning out.
29. 45% of RFPs were submitted through an online portal.
While the percentage of bids submitted through RFP portals has decreased from 51% to 45%, nearly half of total submissions still occur within these systems. This volume has a direct impact on a team’s capacity because portals typically create bottlenecks due to the manual bidding process.
(There may be a competitive advantage for teams who use portal automation tools to speed up this process.)
RFP Software Statistics, Plus AI Usage
30. 69% of teams use an RFP tool or software.
Adoption of RFP response software reached 69% this year, maintaining a consistent upward trajectory. As the bidding landscape accelerates, these tools have become foundational to team operations—no longer an optional upgrade, but essential for keeping pace with the modern market.
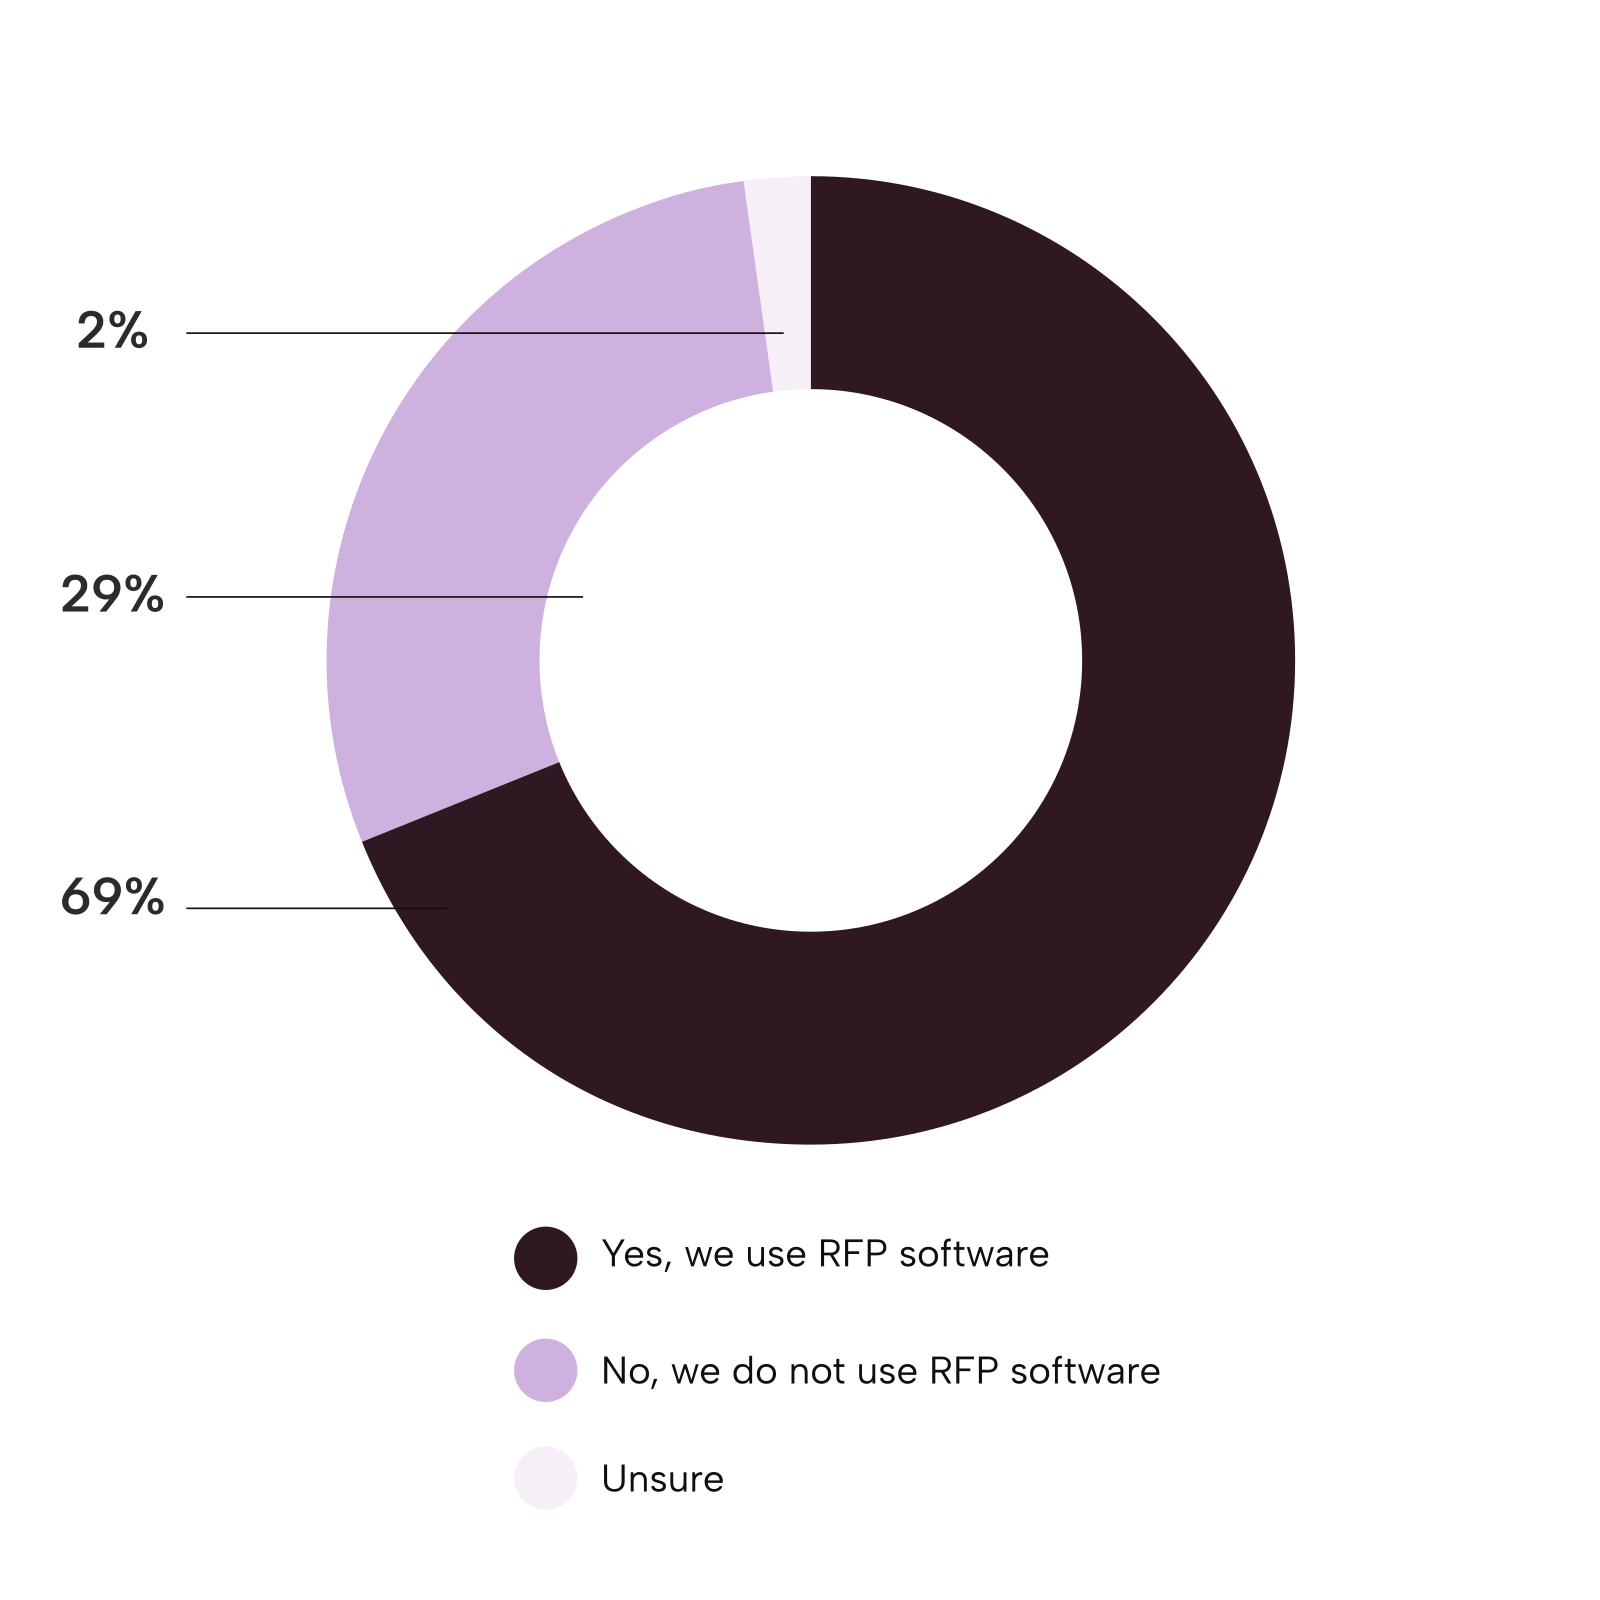
31. 24% of software skeptics claim they haven’t found the right fit.
While a crowded market can lead to decision fatigue, the data suggests that the biggest risk isn’t choosing the wrong tool—it’s staying manual. With a 90% retention rate, it’s clear that once teams adopt a dedicated solution, they rarely look back. For those still on the fence, comparing the best response management tools can help break the stalemate, but the ultimate takeaway is that any specialized software is better than not having any software at all.
32. Yet, RFP software users have higher satisfaction rates.
RFP software users are notably more satisfied with their RFP process than non-users. The largest satisfaction gaps are seen in these areas: the time it takes to complete an RFP (18% higher), collaboration between teams (18%) and their advancement and RFP win rate (13% higher).
33. Teams using RFP software report 8% more manageable stress levels.
37% of teams that use proposal software say their stress levels at work are “almost always manageable” in comparison to their peers without dedicated tools—29% of non-users report manageable stress levels.
34. Almost 80% of teams have used generative AI in their RFP process.
Generative AI has officially transitioned from a novelty to an industry staple. Adoption surged from 68% last year to 79% today. Even more telling is the frequency of use: 84% of those teams now leverage AI at least once a week, cementing it as a foundational component of the modern RFP workflow.
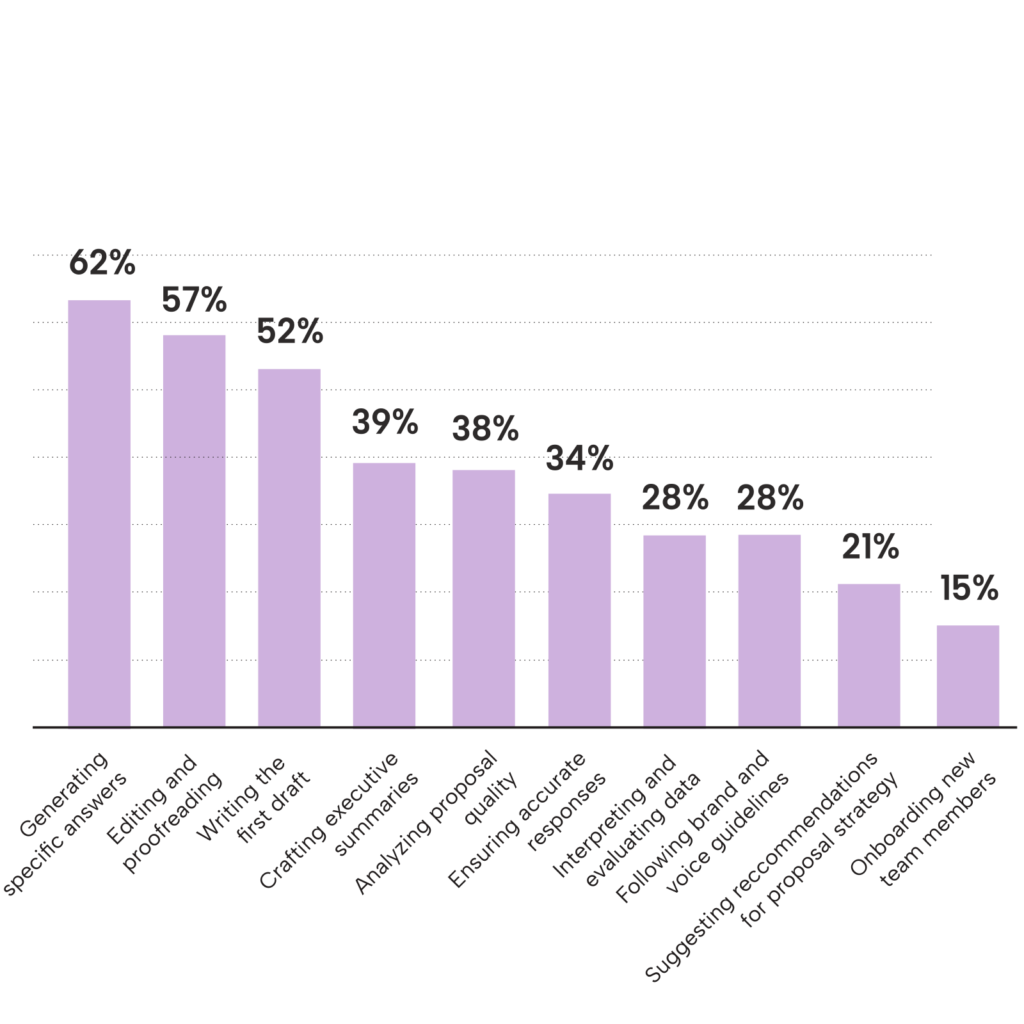
35. 62% of teams use AI tools to generate specific RFP answers.
The reliance on AI for writing-related tasks is on the rise. This year, 62% of teams are using AI to generate specific RFP answers—a 16-point surge from 2024. Other top use cases include editing and proofreading, writing the first draft, crafting executive summaries, and analyzing proposal quality.
2026 RFP Resources and Predictions
36. RFP teams are making do with the resources they currently have.
RFP teams are better equipped than ever: 87% report having the necessary resources and tools to manage their workloads, while only 10% feel significantly under-resourced. Despite this confidence, most teams see room for improvement, signaling that while they are currently effective, they are still eyeing additional tools to reach peak efficiency.
37. 67% of organizations say winning RFPs is a top priority.
With 40% of revenue now tied to formal bids, the mandate is clear: winning RFPs is a non-negotiable priority for 95% of organizations. But while the intent is there, the results are lagging. The drop in win rates indicates that prioritizing RFPs isn’t enough; teams must evolve their approach to capture the revenue they’ve come to rely on.
38. Mastering AI and automation skills will be essential in 2026 for proposal professionals.
Looking at the year ahead, teams believe RFP professionals will need to be experts in these three skills: AI & automation (51%), content messaging and development (48%) and strategic planning and deal Influence (44%). Teams see technical proficiency as a must-have, but acknowledge that unique human qualities like storytelling and critical thinking will still be in high demand.
The last point comes as no surprise–whether you’re learning how to respond to a government RFP, or increasing your volume of private sector submissions, having an efficient RFP response process is critical to closing business faster.
Note: This article is updated annually to reflect new research and RFP statistics.
Download the 2026 RFP Response Trends & Benchmarks Report
Preparing form…