The State of RFPs in 2025: 46 Must-Know Statistics on Win Rates and More

- Average RFP Win Rate and Revenue
- RFP Team Size and Challenges
- RFP Response Timelines
- Submission and Volume Benchmarks
- RFP Software and AI Usage
- 2025 RFP Resources and Predictions
Every RFP team wonders: Are we responding to enough RFPs? Are we investing in the right areas? How does our win rate compare to others in our industry?
With tight deadlines, limited resources, and growing expectations from leadership, maintaining peak performance is no small feat. To stay competitive, you need to know where you stand and what’s working for other teams.
That’s where Loopio’s sixth annual RFP Response Benchmarks & Trends Report comes in. It analyzes data from 1,500+ teams worldwide to uncover key insights on the state of response management, reveal the biggest challenges teams are facing, and examine the tools helping them win more business.
Whether you’re looking to boost efficiency, secure more resources, or improve your win rate, these 46 must-know RFP statistics will give you the insights you need to stay ahead in 2025.
Want more insights on the state of RFPs in 2025? Download the full report. 📘
Average RFP Win Rates and Revenue
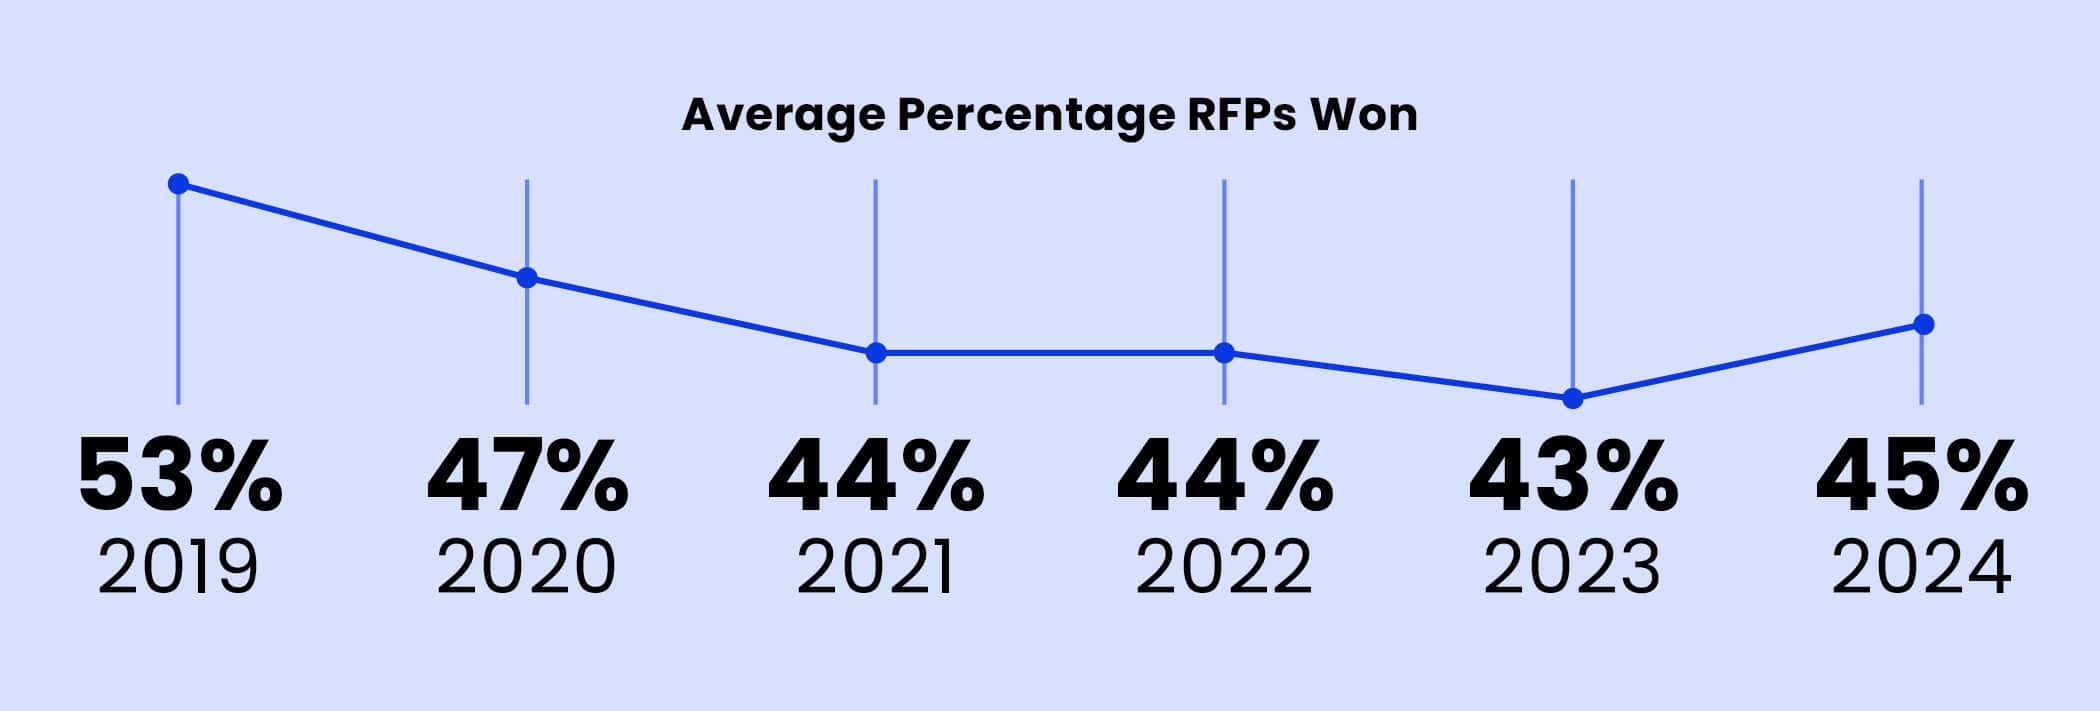
According to the RFP statistics of our survey of 1500+ teams, the average RFP win rate across all industries is 45%, up from 43% in 2024. However, this success metric can vary significantly depending on the industry and company size.
1. RFP win rate statistics: The average is 45%.
What’s a strong proposal win rate? On average, teams win 45% of their RFPs—the highest success rate since 2021 (44%). This upward trend reflects the growing adoption of go/no-go decision processes, allowing teams to focus their efforts on RFPs they have the best chance of winning. (More on that below.)
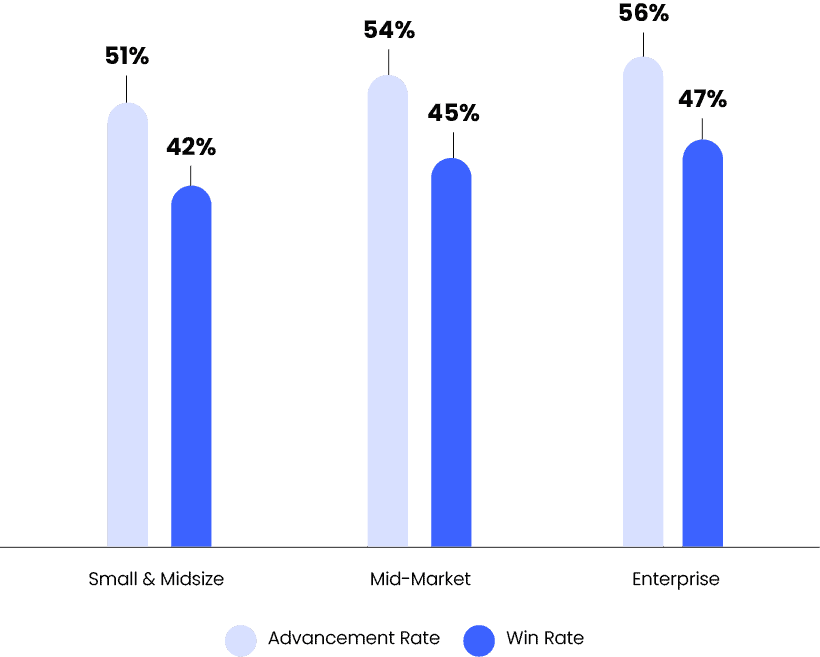
2. Enterprise companies continue to pull in the highest average proposal win rate (but mid-market isn’t far behind).
Enterprise companies (5,001 to 10,000+ employees) win 47% of the RFPs they participate in. But mid-market companies (501 to 5,000 employees) are just 2% behind, calculating a win rate of 45%, up from 42% in 2024.
3. Small companies remain consistent in RFP win rates.
Small and midsize businesses (SMBs) are holding their ground—but the gap is growing. Companies with 1 to 500 employees have maintained a steady RFP win rate of 42% for the past three years. Meanwhile, enterprises continue to gain an edge, benefiting from stronger brand recognition, broader offerings, and deeper resources. While SMBs are staying consistent, the divide between them and enterprise organizations is widening.
4. UK teams achieve the highest RFP win rates globally.
Taking a global perspective, the UK continues to lead in win rates (sitting at 46%), a position they’ve consistently held over the past few years. However, North America and Europe are closing the gap, with win rates of 45% and 44% respectively, showing promising growth in their respective markets.
5. The average RFP advancement rate is 54%.
Advancement rates are somewhat rosier than the average RFP win rate. On average, companies progressed to the shortlist 54% of the time, although this varies by company size. Enterprise teams have the highest advancement rates at 56%, and mid-market and SMBs are slightly behind with advancement rates of 54% and 51%, respectively.
Last year, enterprise and mid-market companies faced a 13-point gap between advancing to the shortlist and winning a deal—compared to nine points for SMBs. This year, that gap has narrowed to nine points across all company sizes. The takeaway? Larger companies are becoming more efficient at converting opportunities into wins, closing the gap that once gave SMBs an advantage.
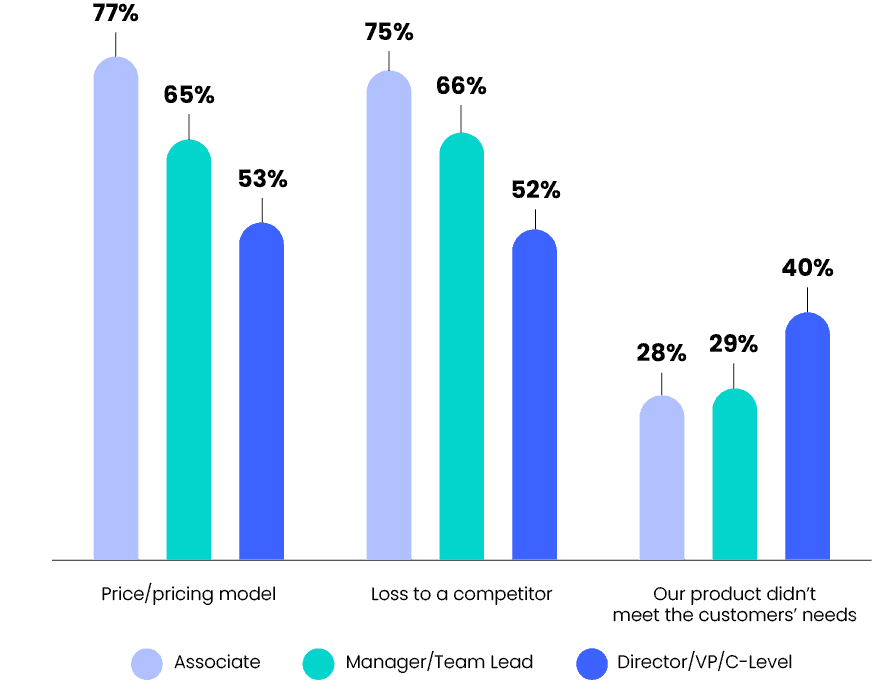
6. The top reason for losing a bid? It’s a tie between “price” and “competition.”
For years, “price” has been the go-to reason for losing a bid, holding the top spot since 2021. But this year marks a shift—not only has the percentage of respondents citing “price” dropped from 67% to 61%, but it’s now tied with “losing to a competitor or incumbent.” This signals a changing landscape where brand reputation, relationships, and competitive positioning are just as critical as cost when it comes to winning RFPs.
7. Upper management shifts perspective, attributing losses to the product.
There’s a widening gap between how upper management and associates perceive lost deals. Associates are still more likely to blame price, while directors and executives increasingly point to the product as the key issue.
Interestingly, this divide is growing. In recent years, both groups aligned more closely on price—likely due to economic uncertainty. But as the market stabilizes, 40% of senior leaders appear more convinced than ever that product shortcomings, not pricing, are the real barrier to winning deals.
8. Annual revenue from RFPs is $256 million.
Over the past six years, RFPs have consistently influenced around 30-40% of company revenue. While this year is no different, there was a noticeable drop in the average amount, from $317 million in 2024 to $256 million. What’s the reason? The answer could be lower submission volumes (more on that below).
9. The healthcare industry generates the most revenue from RFPs.
RFPs bring in an average of $256 million annually for organizations. But in the healthcare industry, that number skyrockets—topping $1.05 billion in RFP deals. That’s more than double the revenue of the next highest-earning industry, advertising and publishing, which brings in $499 million.
10. More teams are tracking key RFP metrics beyond win rate.
Win rate is the number one metric for measuring RFP success, but it doesn’t tell the whole story—and most teams are taking notice. While 96% of teams are tracking success metrics (a 6% increase from 5 years ago), there’s also an increase in those tracking granular metrics such as advancement rate, speed of completion, cost per bid, and team performance. Digging deeper into these insights could be the key to higher win rates as teams focus on improving their response process.
💡How Do You Win More RFPs? Insights from Top Performers
Top performers are defined as teams that win more than 50% of their RFP submissions. What’s their secret to high win rates? Here’s what they do differently:
🚦They are selective about RFPs: 6 out of 7 top performers use an RFP evaluation process, and 63% are satisfied with its execution. This shows that being choosy helps you focus on high-probability deals (and take them over the finish line.)
💻They harness RFP software: Over two-thirds of top performers use RFP response software to maintain simplified content libraries, auto-generate answers to common RFP questions, automatically manage content reviews, and more.
🤖They embrace AI support: 72% of top performers have used AI for proposal writing and other RFP tasks in the last year. What’s more, nearly three-quarters express positive feelings towards using these tools in the RFP process.
This is just a sneak peek into the winning habits of top performers. For the full list of how to increase your win rate, check out the final chapter of the 2025 Report.
RFP Team Size and Challenges
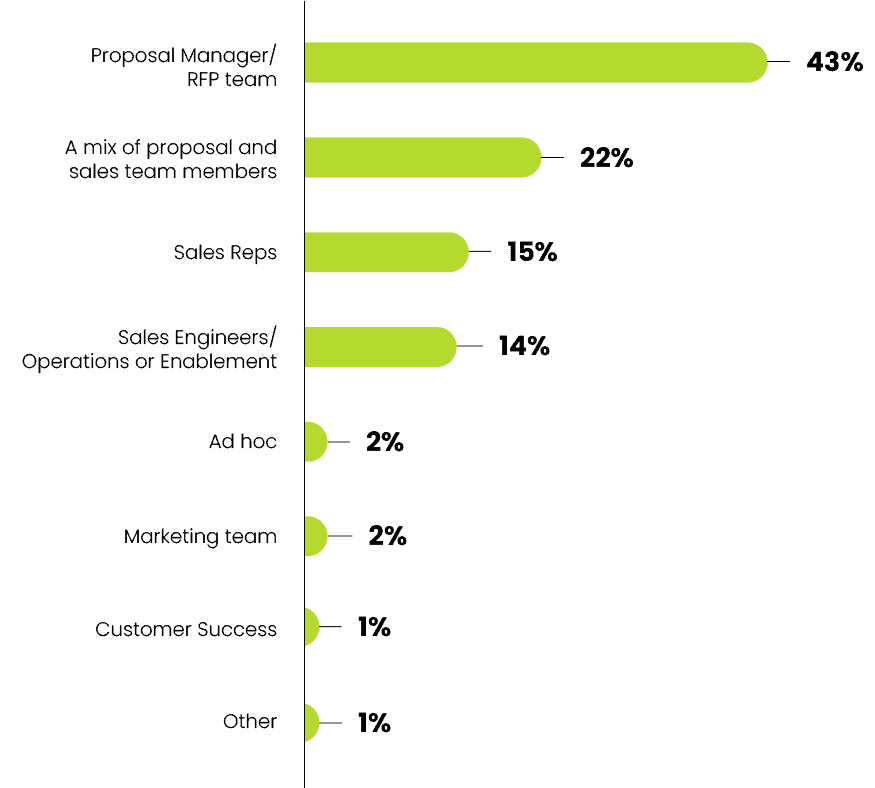
11. Fewer respondents report having a dedicated proposal team or manager.
In 2023, 56% of respondents had a dedicated team or writer managing RFPs. By 2024, that number dropped to 43%—reversing a long-standing trend toward RFP specialization. This shift may be tied to widespread layoffs and restructuring, as companies under economic pressure deprioritize dedicated RFP roles.
But if proposal teams aren’t taking the lead on RFPs, then who is? Our data shows that sales roles are taking on this responsibility more than ever—now accounting for 51% of those managing the RFP process.
12. Even if there is a proposal team on board, they report to sales.
For businesses with a dedicated proposal team, nearly half now report to sales—a significant jump from 35% last year. Marketing remains a distant second. This shift aligns with the broader trend of increased sales involvement in the RFP process, signaling a deeper integration between proposal and revenue teams.
13. The public sector doubled down on RFP ownership.
While most industries saw a decline in dedicated RFP ownership, the public sector bucked the trend with a significant increase. Last year, 50% of this industry reported having a dedicated RFP team—this year, that number has surged to 72%.
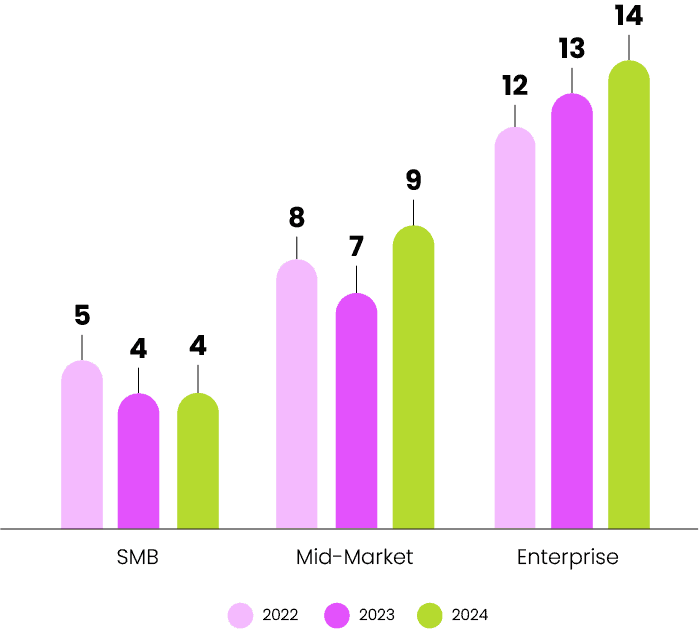
14. For the third year in a row, the average RFP team size is 8 people.
Despite the recent upheaval, the average RFP team size has held steady—but beneath the surface, shifts are happening. Most teams have grown slightly, except in technology and the public sector, which have shrunk. This year, insurance, healthcare, and advertising dominate with the largest teams.
15. Every RFP involves an average of 9 contributors to complete.
On average, nine people contribute to each RFP—a number that has remained steady since 2021. Most teams involve between 6 and 15 contributors, with the median creeping up slightly since last year.
16. Enterprise teams continue to grow, whereas SMB teams have not.
Enterprise RFP teams have grown by one person per year for the past three years, now averaging 14 members. SMB teams remain steady at four, creating a 10-person gap to enterprise teams. Meanwhile, mid-market saw the biggest gain, adding two members this year, bringing their average from seven to nine.
17. Teams feel more satisfied with their RFP process.
RFP satisfaction is on the rise. This year, 64% of respondents reported being satisfied with their RFP process—a dramatic jump from just 39% last year. (Find out what factors might be contributing to this change of heart in the full report.)
18. 1 in 5 RFP teams report feeling unmanageable stress.
Stress may feel like a natural byproduct of the fast-paced RFP process, but the data says otherwise: Teams experiencing high-stress levels take 10 hours longer per RFP and win fewer deals than their less-stressed peers. In other words, burnout isn’t a sign of working harder—it’s a barrier to success.
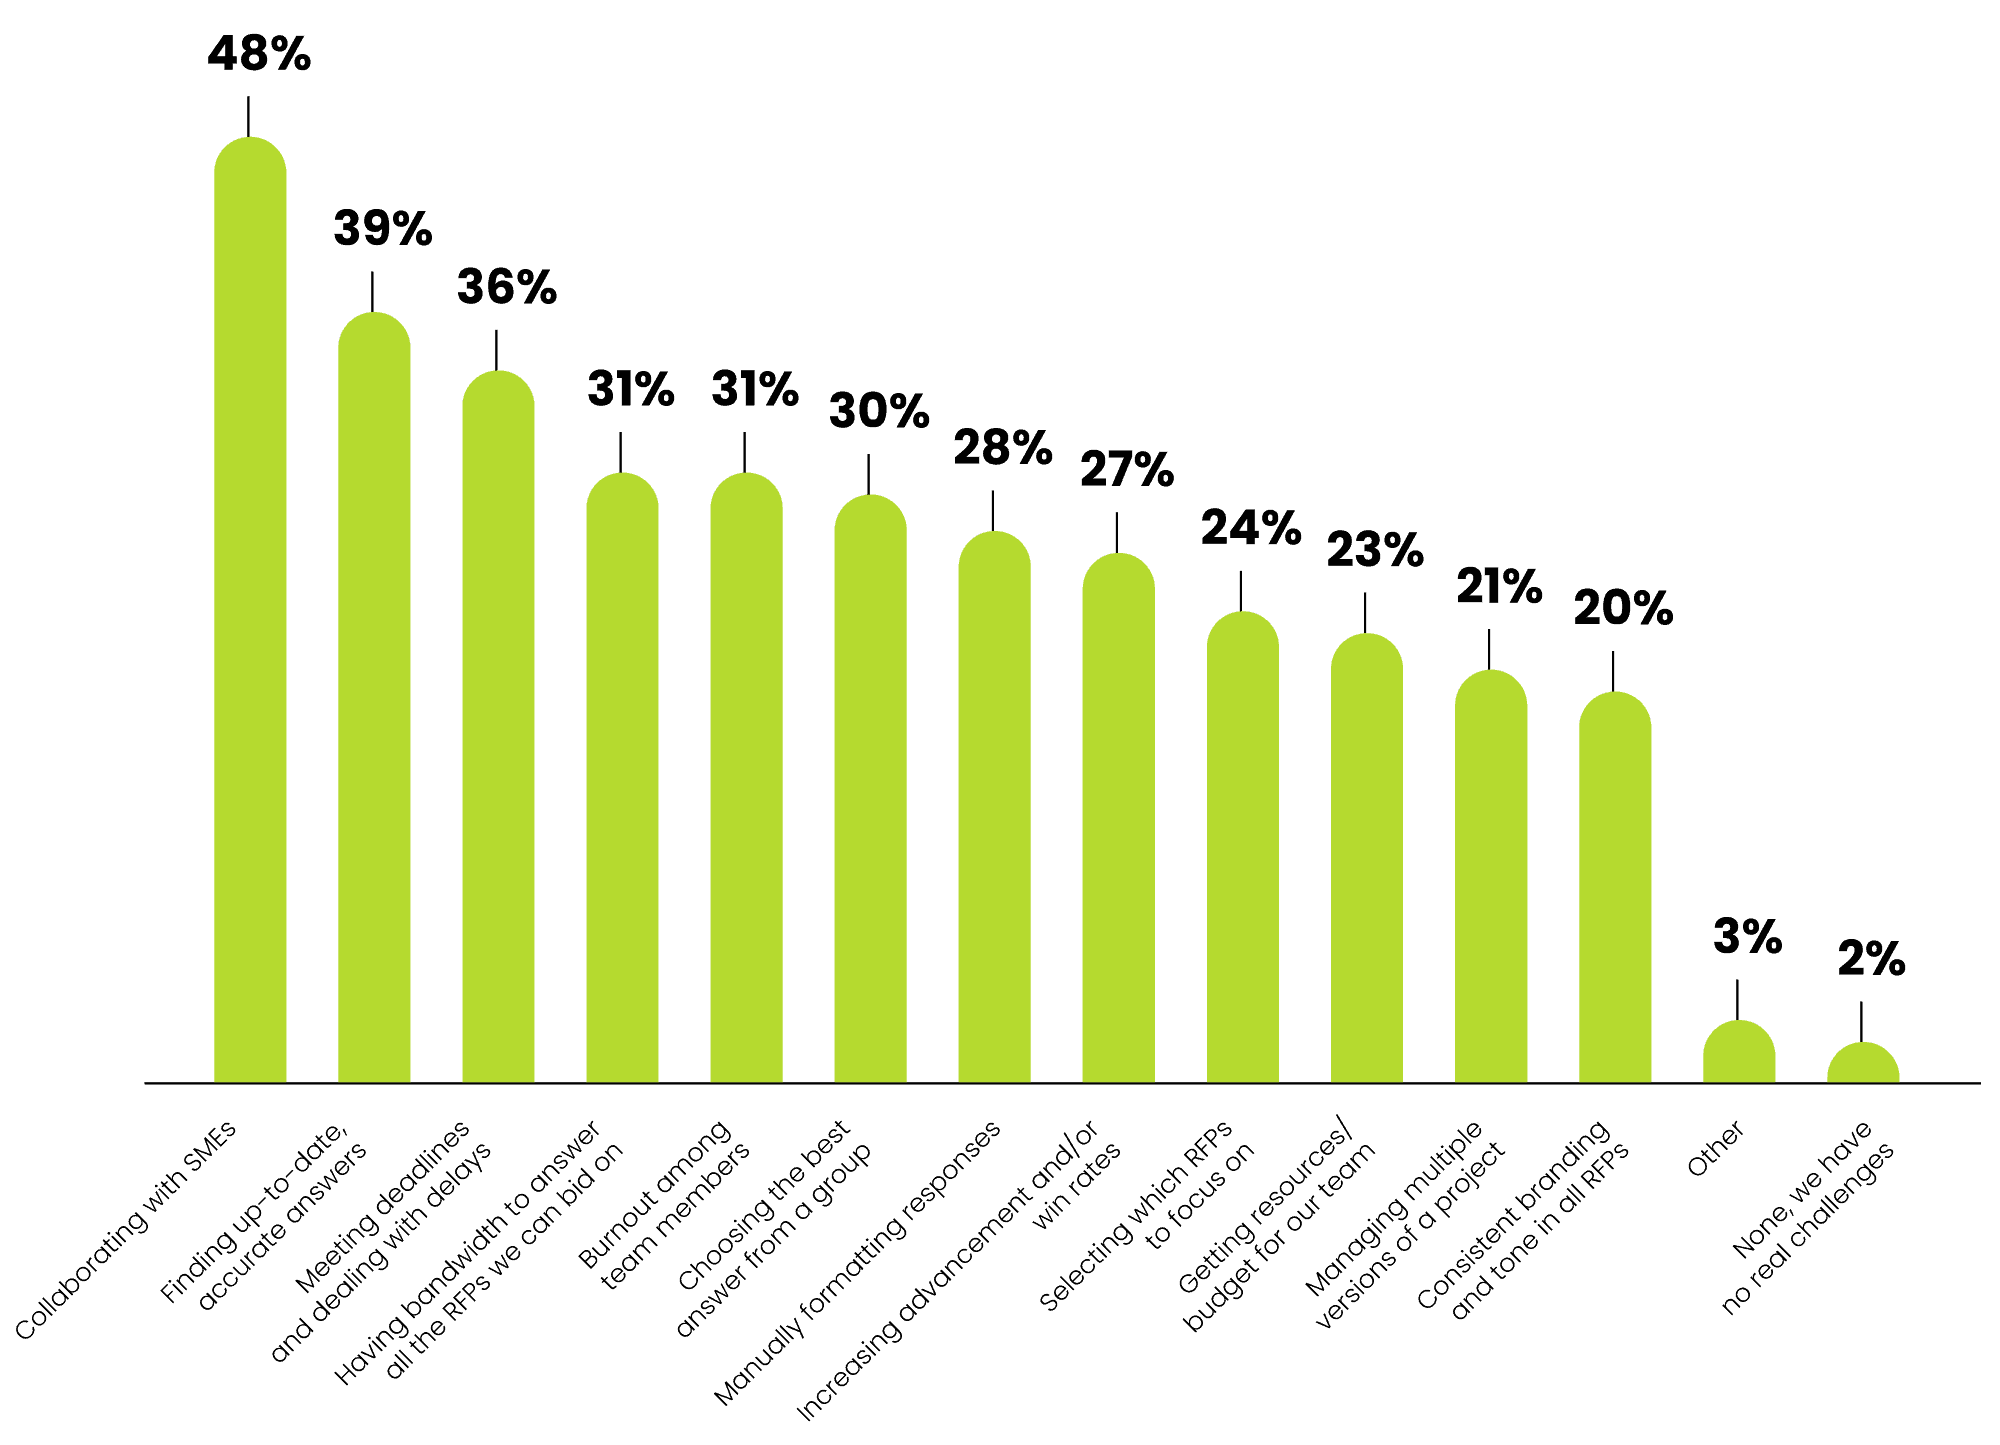
19. Almost half of teams find it challenging to work with internal experts.
For the fifth year in a row, RFP teams reported that collaborating with subject matter experts was their biggest challenge (48%). Other top struggles include finding up-to-date, accurate answers (39%), meeting deadlines and managing delays (36%), and balancing workload—where limited bandwidth and burnout tied at 31%. These challenges remain largely unchanged from 2023, signaling that many teams are still searching for effective solutions.
20. More than half of teams gained new resources in 2024.
Over half (52%) of respondents reported gaining new resources—whether headcount, budget, or software—a sharp increase from 34% the year before.
RFP Response Timelines
21. The average time to write a proposal has sped up.
Last year, teams spent an average of 30 hours crafting a single RFP response. This year, that time has dropped to 25 hours per RFP. How are teams saving an extra five hours? One theory is the widespread adoption of RFP software and AI tools, which are driving noticeable efficiency gains. (More on that below.)
22. SMBs come in first for the fastest proposal writing times.
As in previous years, small and midsize RFP teams spend the least amount of time writing proposals—averaging 20 hours per response (just under three business days). While efficiency is important, it’s crucial to balance speed with quality to maximize your chances of winning the bid. The data shows that SMBs, who tend to prioritize speed, also experience the lowest win rates.
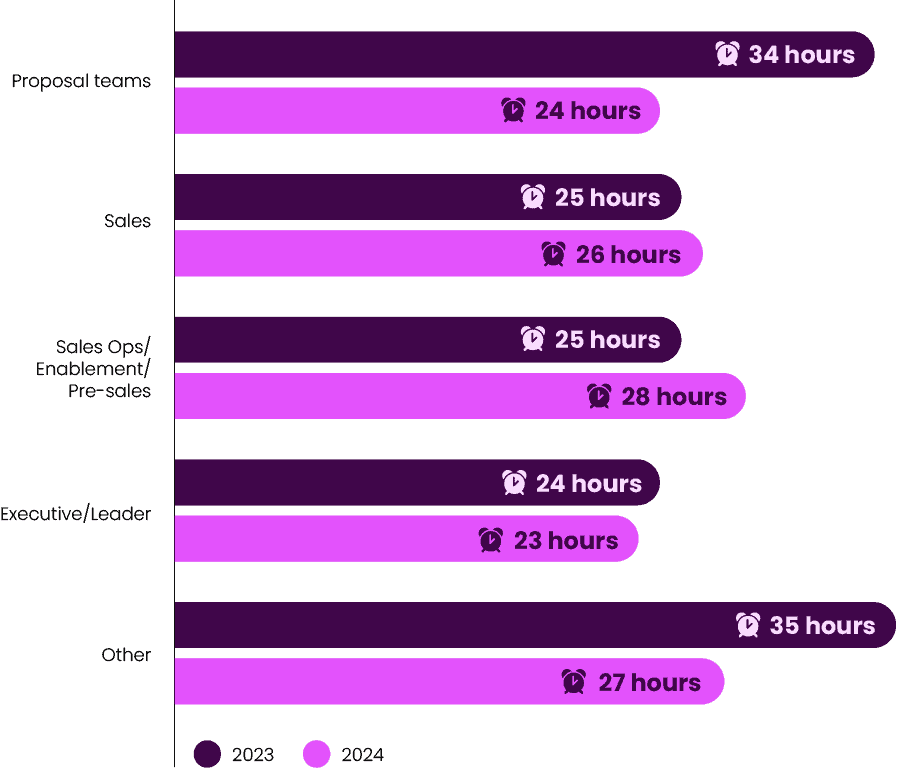
23. From second-slowest to fastest, proposal teams spend less time writing.
Last year, proposal teams had the second-longest writing time at 34 hours per RFP response. This year, they’ve become the fastest, reducing their average to 24 hours (a personal record). While all roles saw increased adoption of software and AI, proposal teams likely benefited the most from these time-saving technologies, given the writing-intensive nature of their work.
24. More teams are completing RFPs in less than 10 days.
It’s not just writing time that’s speeding up—overall turnaround time for RFP responses has also accelerated. Last year, 59% of teams responded to RFPs in 10 days or fewer on average. This year, that number has risen to 64%. It’s clear that more and more teams are finding ways to boost efficiency.
25. SMB and mid-market companies made the biggest efficiency gains.
While fewer enterprise companies turn around RFPs in under 10 business days, there’s been a significant increase in SMBs and mid-market companies responding faster—71% of SMB teams and 66% of mid-market teams are now hitting these quicker timelines. This acceleration is likely driven by their faster adoption of time-saving technologies.
26. Longer writing time still leads to higher win rates, but the race is on.
While the average time for writing a proposal is 25 hours, top-performing teams spend four hours longer. Even though these high achievers still take a bit longer, they have also cut down their average writing time (from 32 to 29 hours). This is likely because the majority of top performers use RFP software and AI tools to improve efficiency. Yet, it’s important to note that they still dedicate extra time to crafting high-quality proposals to maintain higher win rates.
For more insights on proposal writing timelines, download the RFP Trends & Benchmarks Report.
RFP Volume and Submission Benchmarks
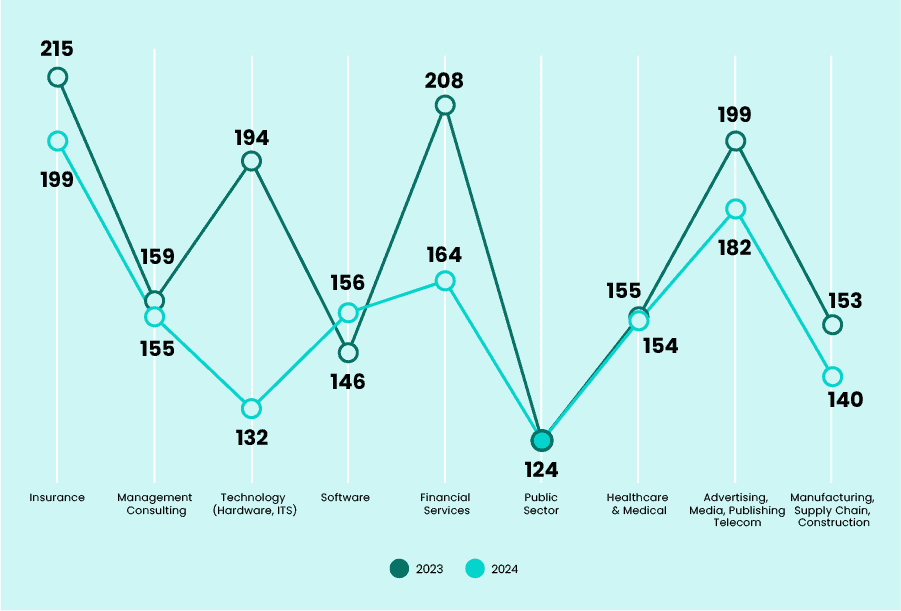
27. On average, organizations submit 153 RFPs annually.
Organizations now respond to an average of 153 RFPs per year, down from 175 last year. But there’s a discrepancy: While most teams report submitting more RFPs, a sharp decline among outliers has pulled the overall average down.
28. Only 10% of teams submit more than 500 RFPs per year.
RFP submission volume varies widely across organizations, but high-volume teams are the exception, not the rule. Only 10% of teams submit more than 500 RFPs annually, while the majority (41%) fall within the 51-250 range. At the other end of the spectrum, just 5% submit fewer than 10 RFPs per year.
29. The insurance industry submits the most RFPs annually.
Insurance remains the leader in the number of RFP submissions, with advertising and financial services securing second and third place. These industries have consistently dominated the top three spots since our survey began, underscoring the vital role RFPs play in these fields.
30. Enterprise companies submit 3.7x more RFPs than SMBs.
It’s no surprise that larger companies handle more RFPs annually, given their formalized sales cycles. However, as RFP submissions declined across the board, smaller companies saw a sharper drop (15%) compared to enterprise organizations (9%), further widening the gap between them.
31. Organizations typically respond to two-thirds of the RFPs they receive.
On average, organizations respond to 63% of the RFPs their company receives—meaning most teams deem two-thirds of bids worth answering. This is an encouraging sign that teams are choosier about which proposals they take on in general—focusing on quality versus quantity to secure an RFP win.
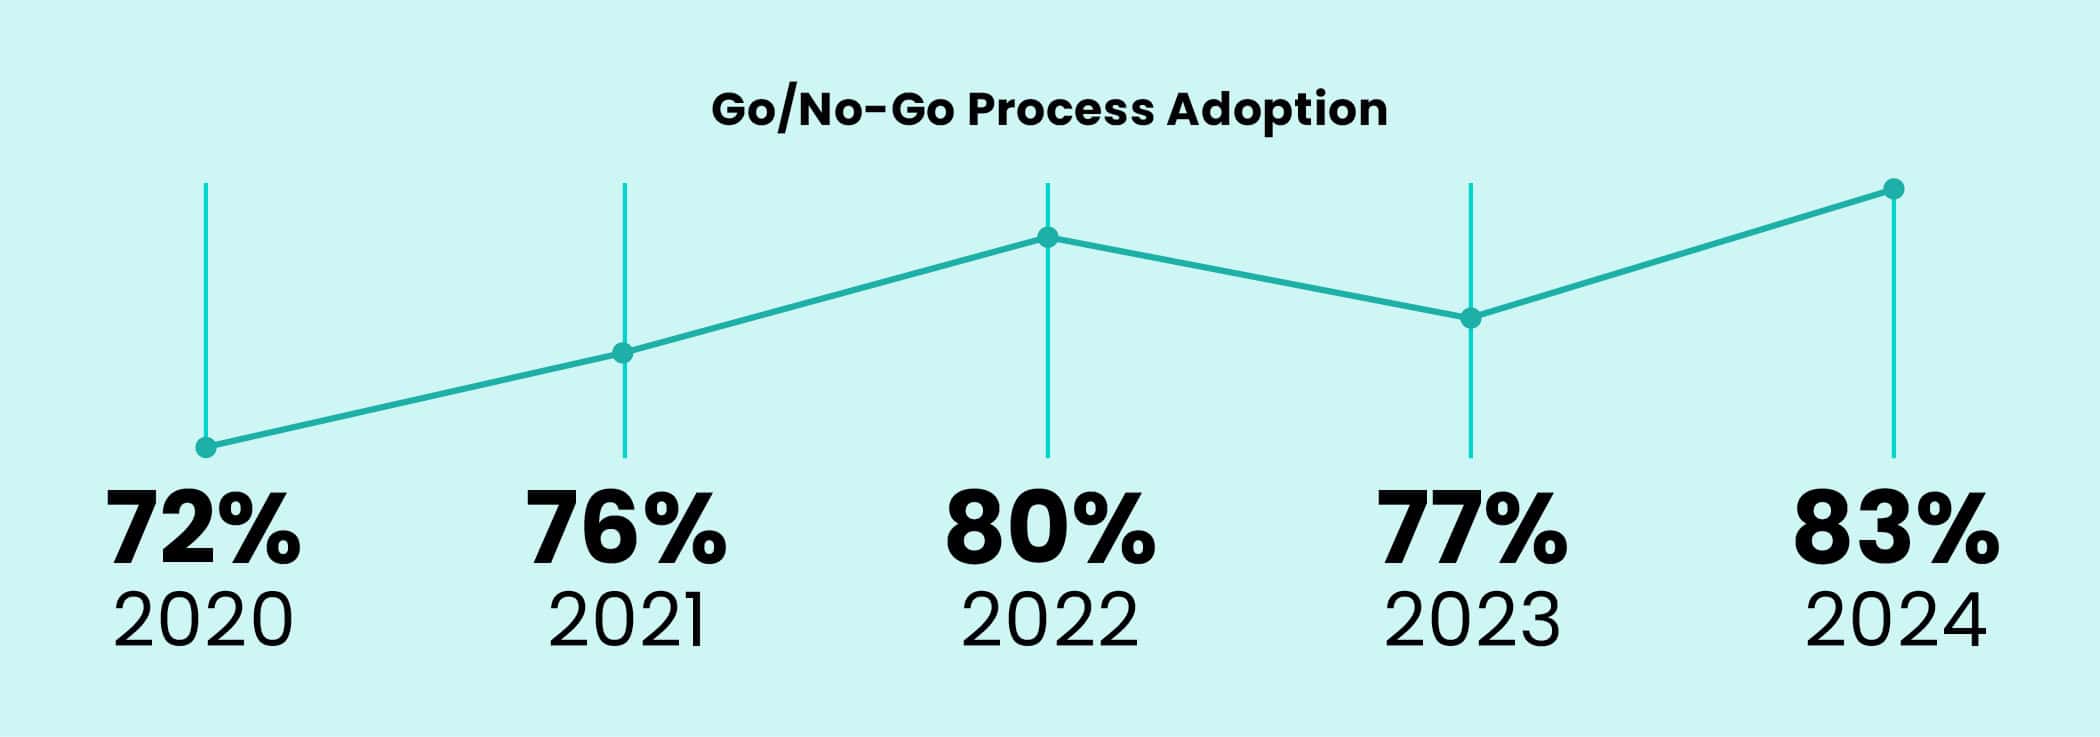
32. 83% of teams use a go/no-go process for RFPs, a jump from last year.
This year, 83% of teams are using a go/no-go decision template to evaluate whether an RFP is worth pursuing, marking a 6% increase from last year. This shift suggests a return to stability after a period of economic uncertainty, with teams now able to be more selective rather than pursuing every opportunity.
33. Teams with an RFP tool submit 51 more responses annually.
Teams with RFP software respond to an average of 171 RFPs annually, while those without software respond to only 150. They also have slightly higher win rates (46% compared to 44% for non-software users).
34. 51% of RFPs were submitted through an online portal.
The percentage of bids submitted through online portals remained steady at 51%, with just a 1% increase from last year. (There may be a competitive advantage to proactively seeking more bids, or capture planning, using online portals.)
RFP Software Statistics, Plus AI Usage
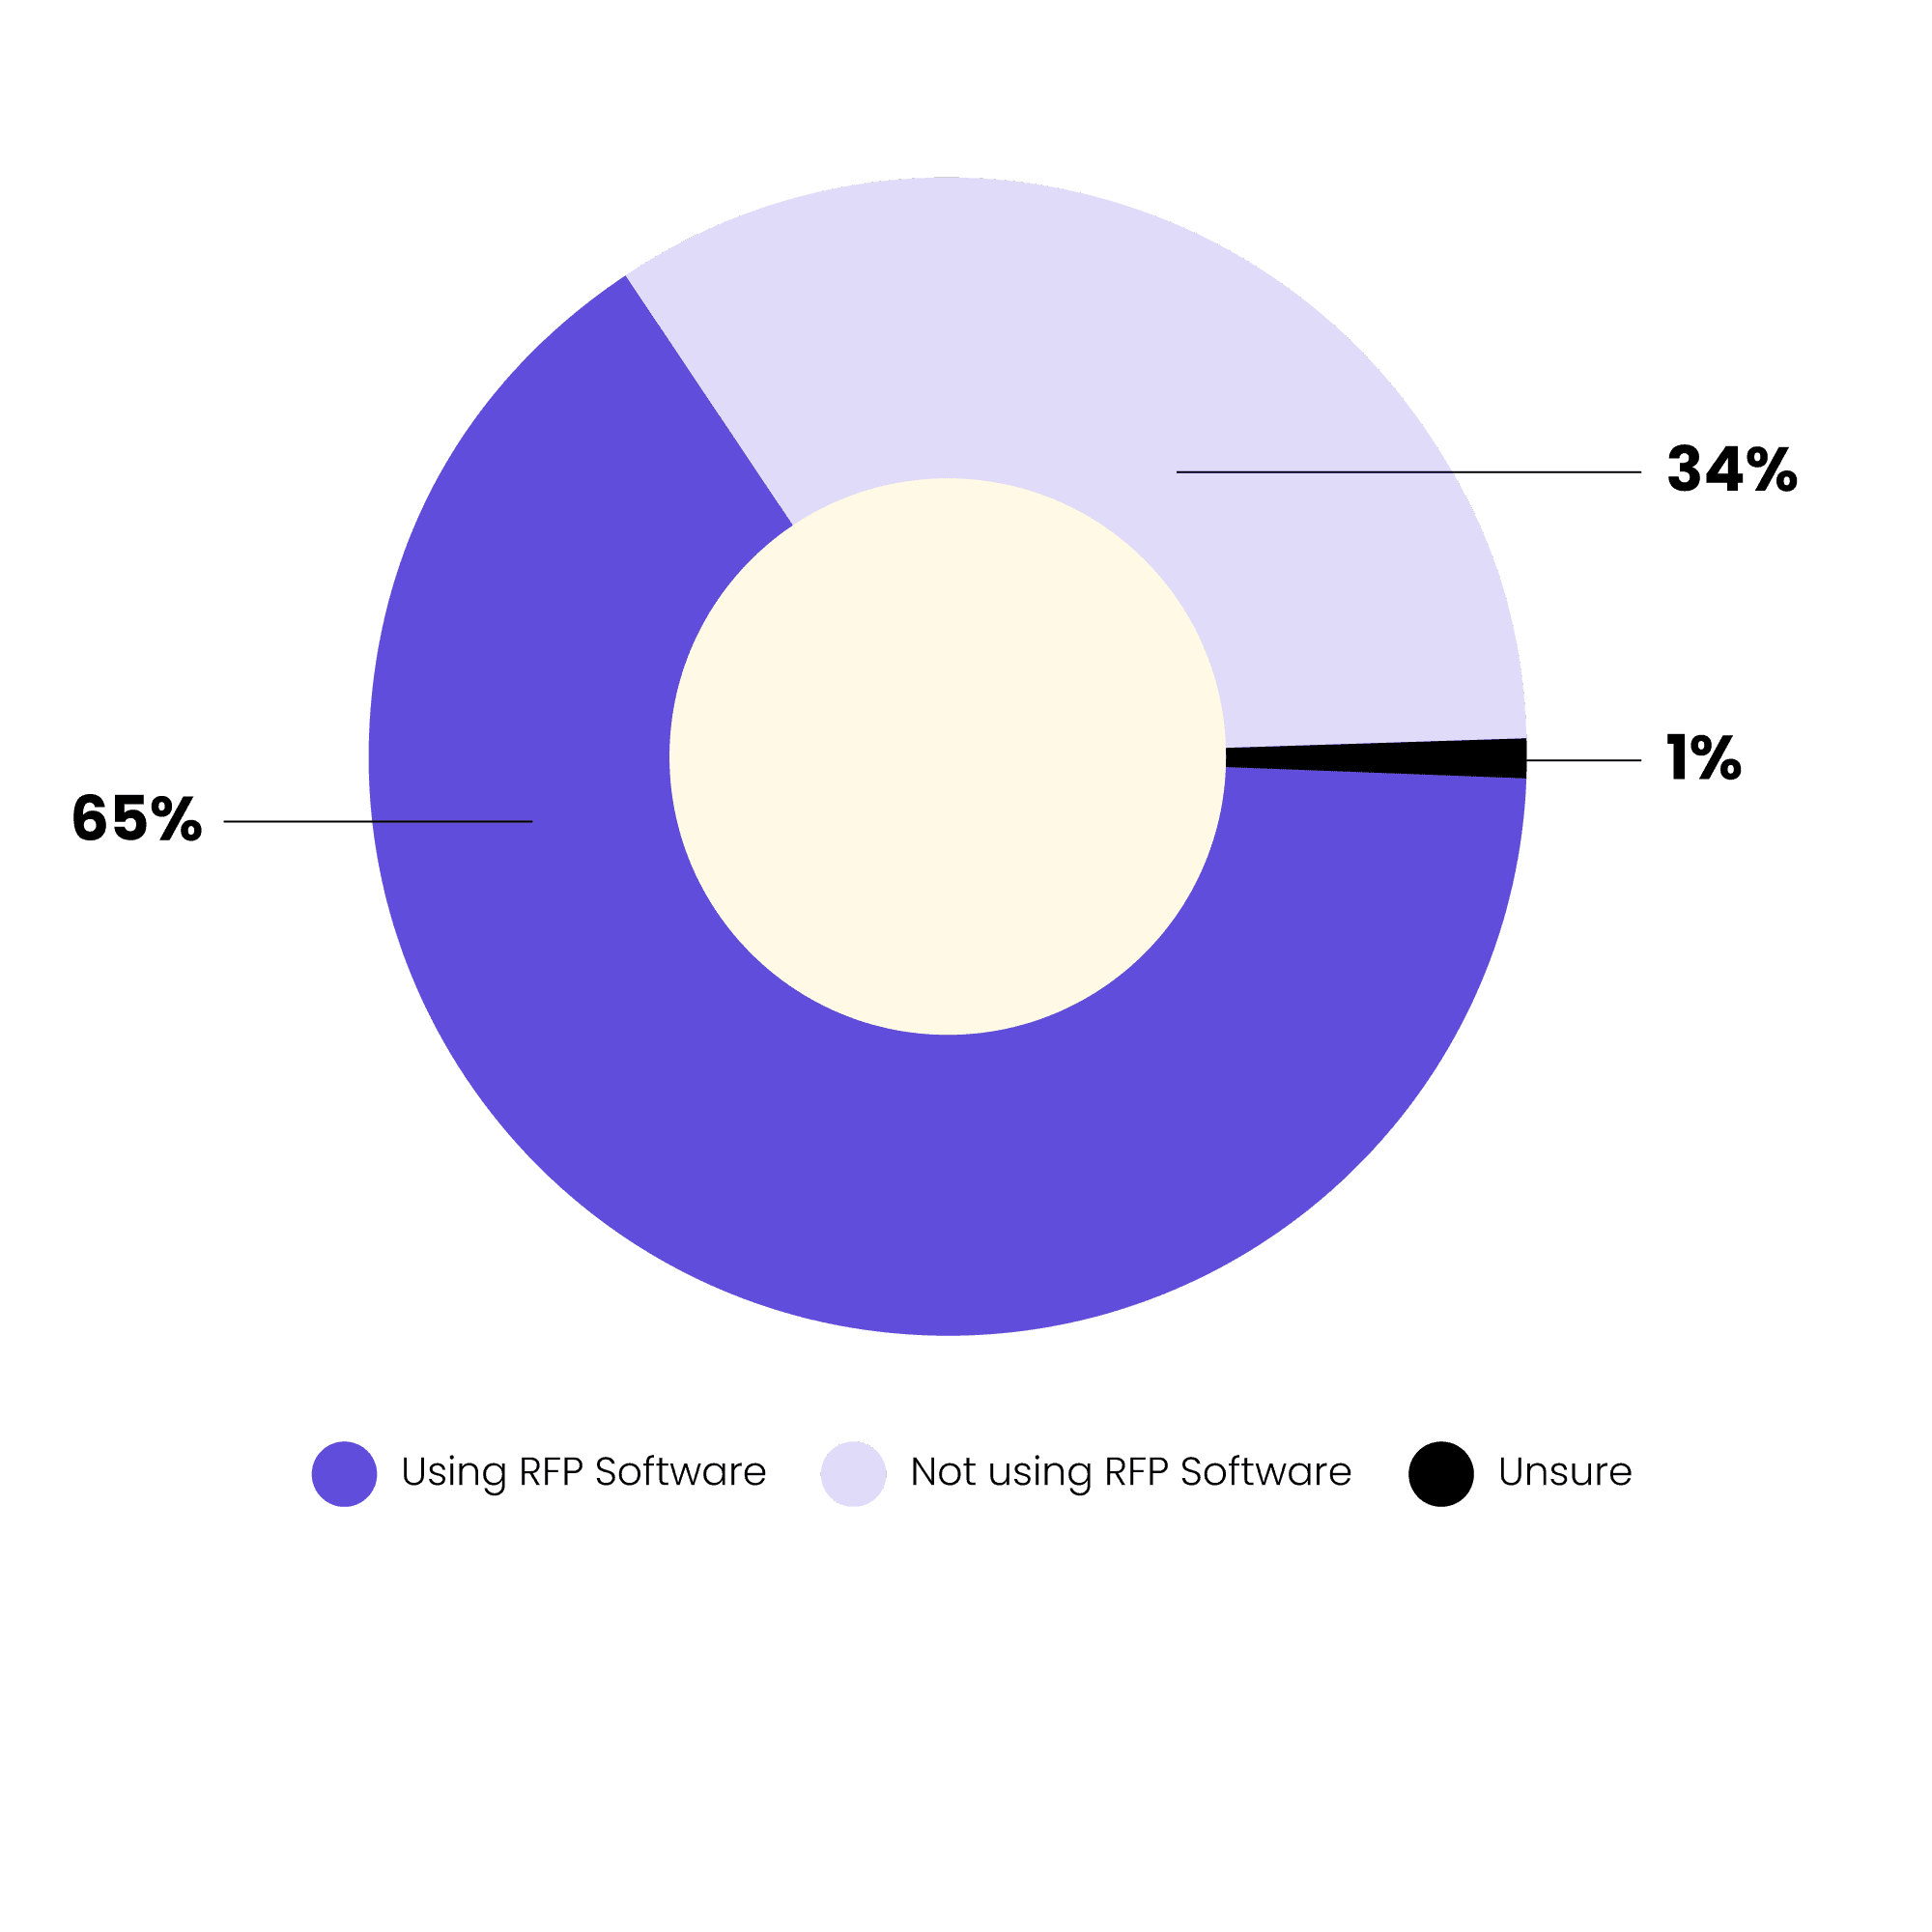
35. 65% of teams use an RFP tool or software.
The majority of respondents (65%) now use RFP software or proposal management tools. This is a huge increase from the 48% who were using it last year.
36. Top-rated benefit of using RFP software = improved content storage.
Improved content storage (51%) and time savings (50%) remain the top benefits of using RFP software, consistently ranking highest year over year. However this year, more teams are noticing additional advantages, with 11% more citing increased win rates and 7% more reporting faster sales cycles.
37. The percentage of teams who say they don’t need RFP software is dropping.
The percentage of teams who feel they don’t need RFP software has continued to decline year-over-year, dropping from 28% in 2022 to 20% in 2024. Perhaps the software skeptics are coming around to the top benefits listed above.
38. 44% of software skeptics claim they already have other tools that work.
What tools are still getting the job done? The most commonly used alternatives include cloud document-sharing platforms like Google and Microsoft (69%), email (66%), and collaboration tools such as Slack and Microsoft Teams (66%).
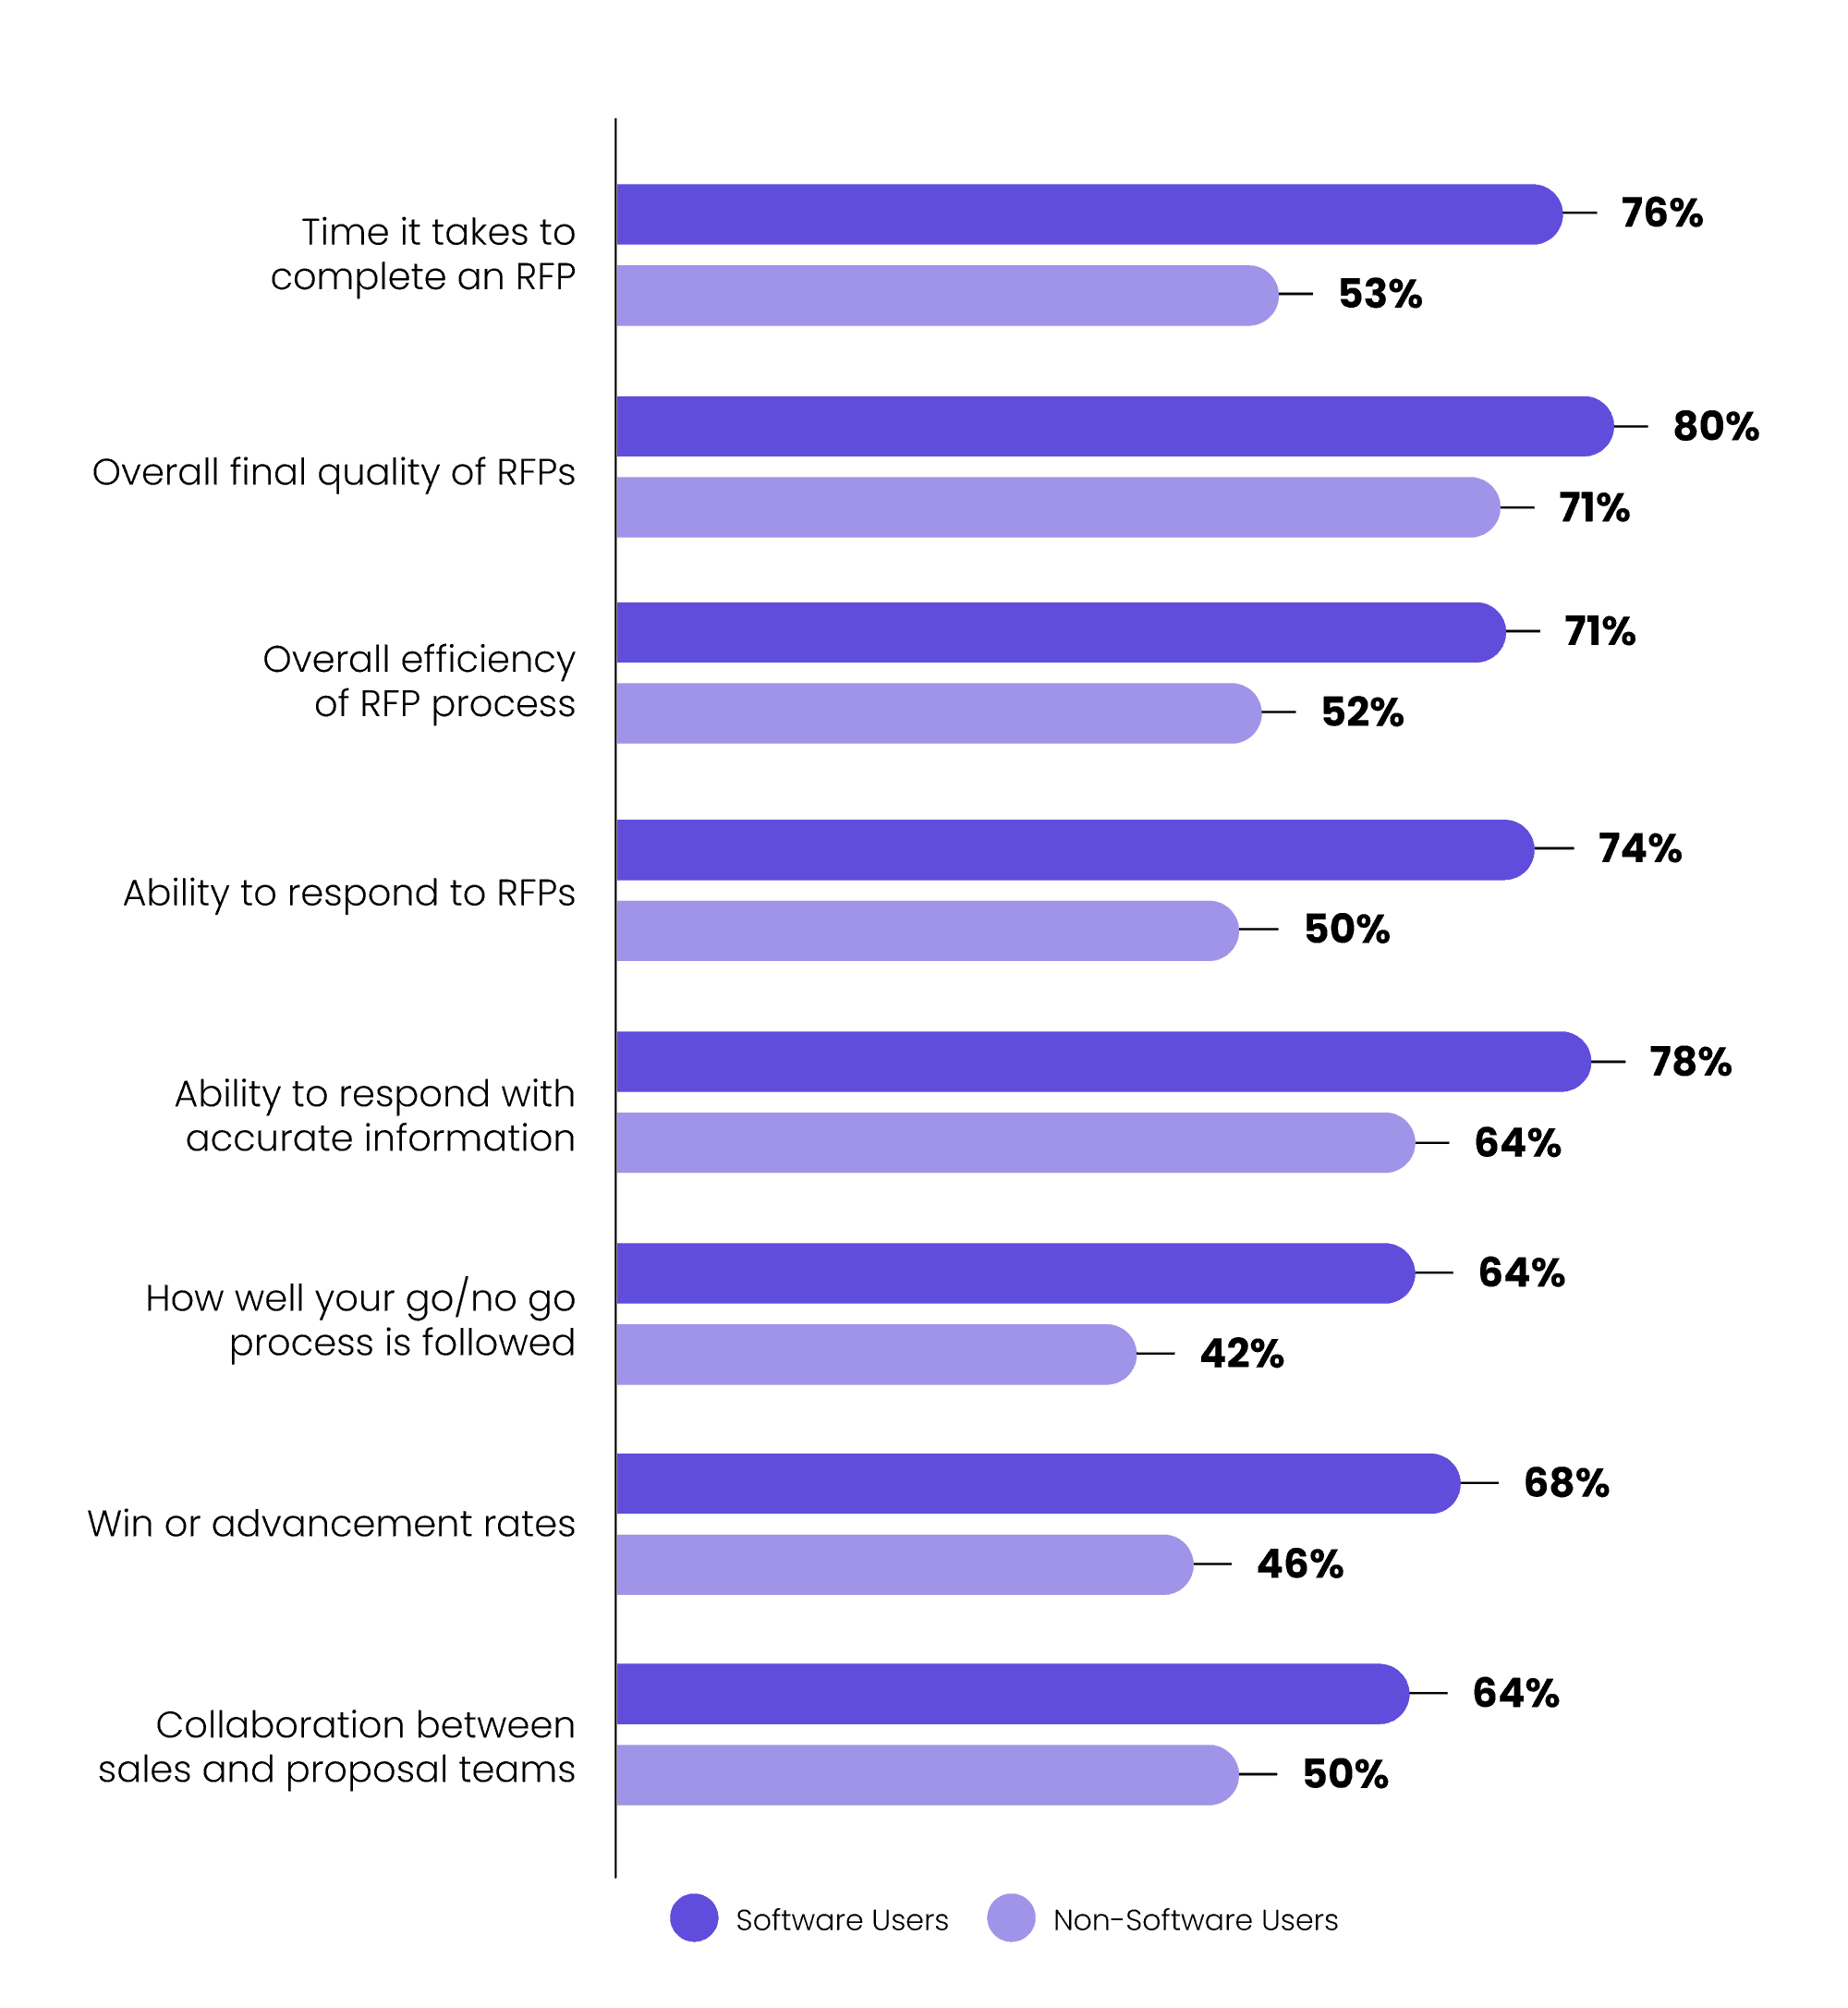
39. Yet, RFP software users have higher satisfaction rates.
RFP software users are notably more satisfied with their RFP process than non-users. The largest satisfaction gaps are seen in these areas: the ability to respond to RFPs (24% higher), the time it takes to complete an RFP (23% higher), and their overall proposal win rate (22% higher). The latter aligns with research showing that happier teams tend to perform better.
40. Proposal teams using software report 11% more manageable stress levels.
68% of teams that use proposal software say their stress levels at work are “almost always manageable” in comparison to their peers without dedicated tools—57% of non-users report manageable stress levels.
41. 61% of companies see ROI in less than one year with RFP software.
The time to ROI increases with company size. While 74% of SMBs experience ROI in less than a year, only 67% of mid-market companies and 44% of enterprise firms see the same quick returns—highlighting the stark contrast in rollout speeds.
42. More than two-thirds of teams have used generative AI in their RFP process.
In 2023, RFP teams were just starting to explore generative AI, but weren’t yet fully integrating it into their workflows. This year, that curiosity has turned into widespread adoption, with 68% of teams now using generative AI—more than double last year’s 34%. Of those using AI, 32% use it daily.
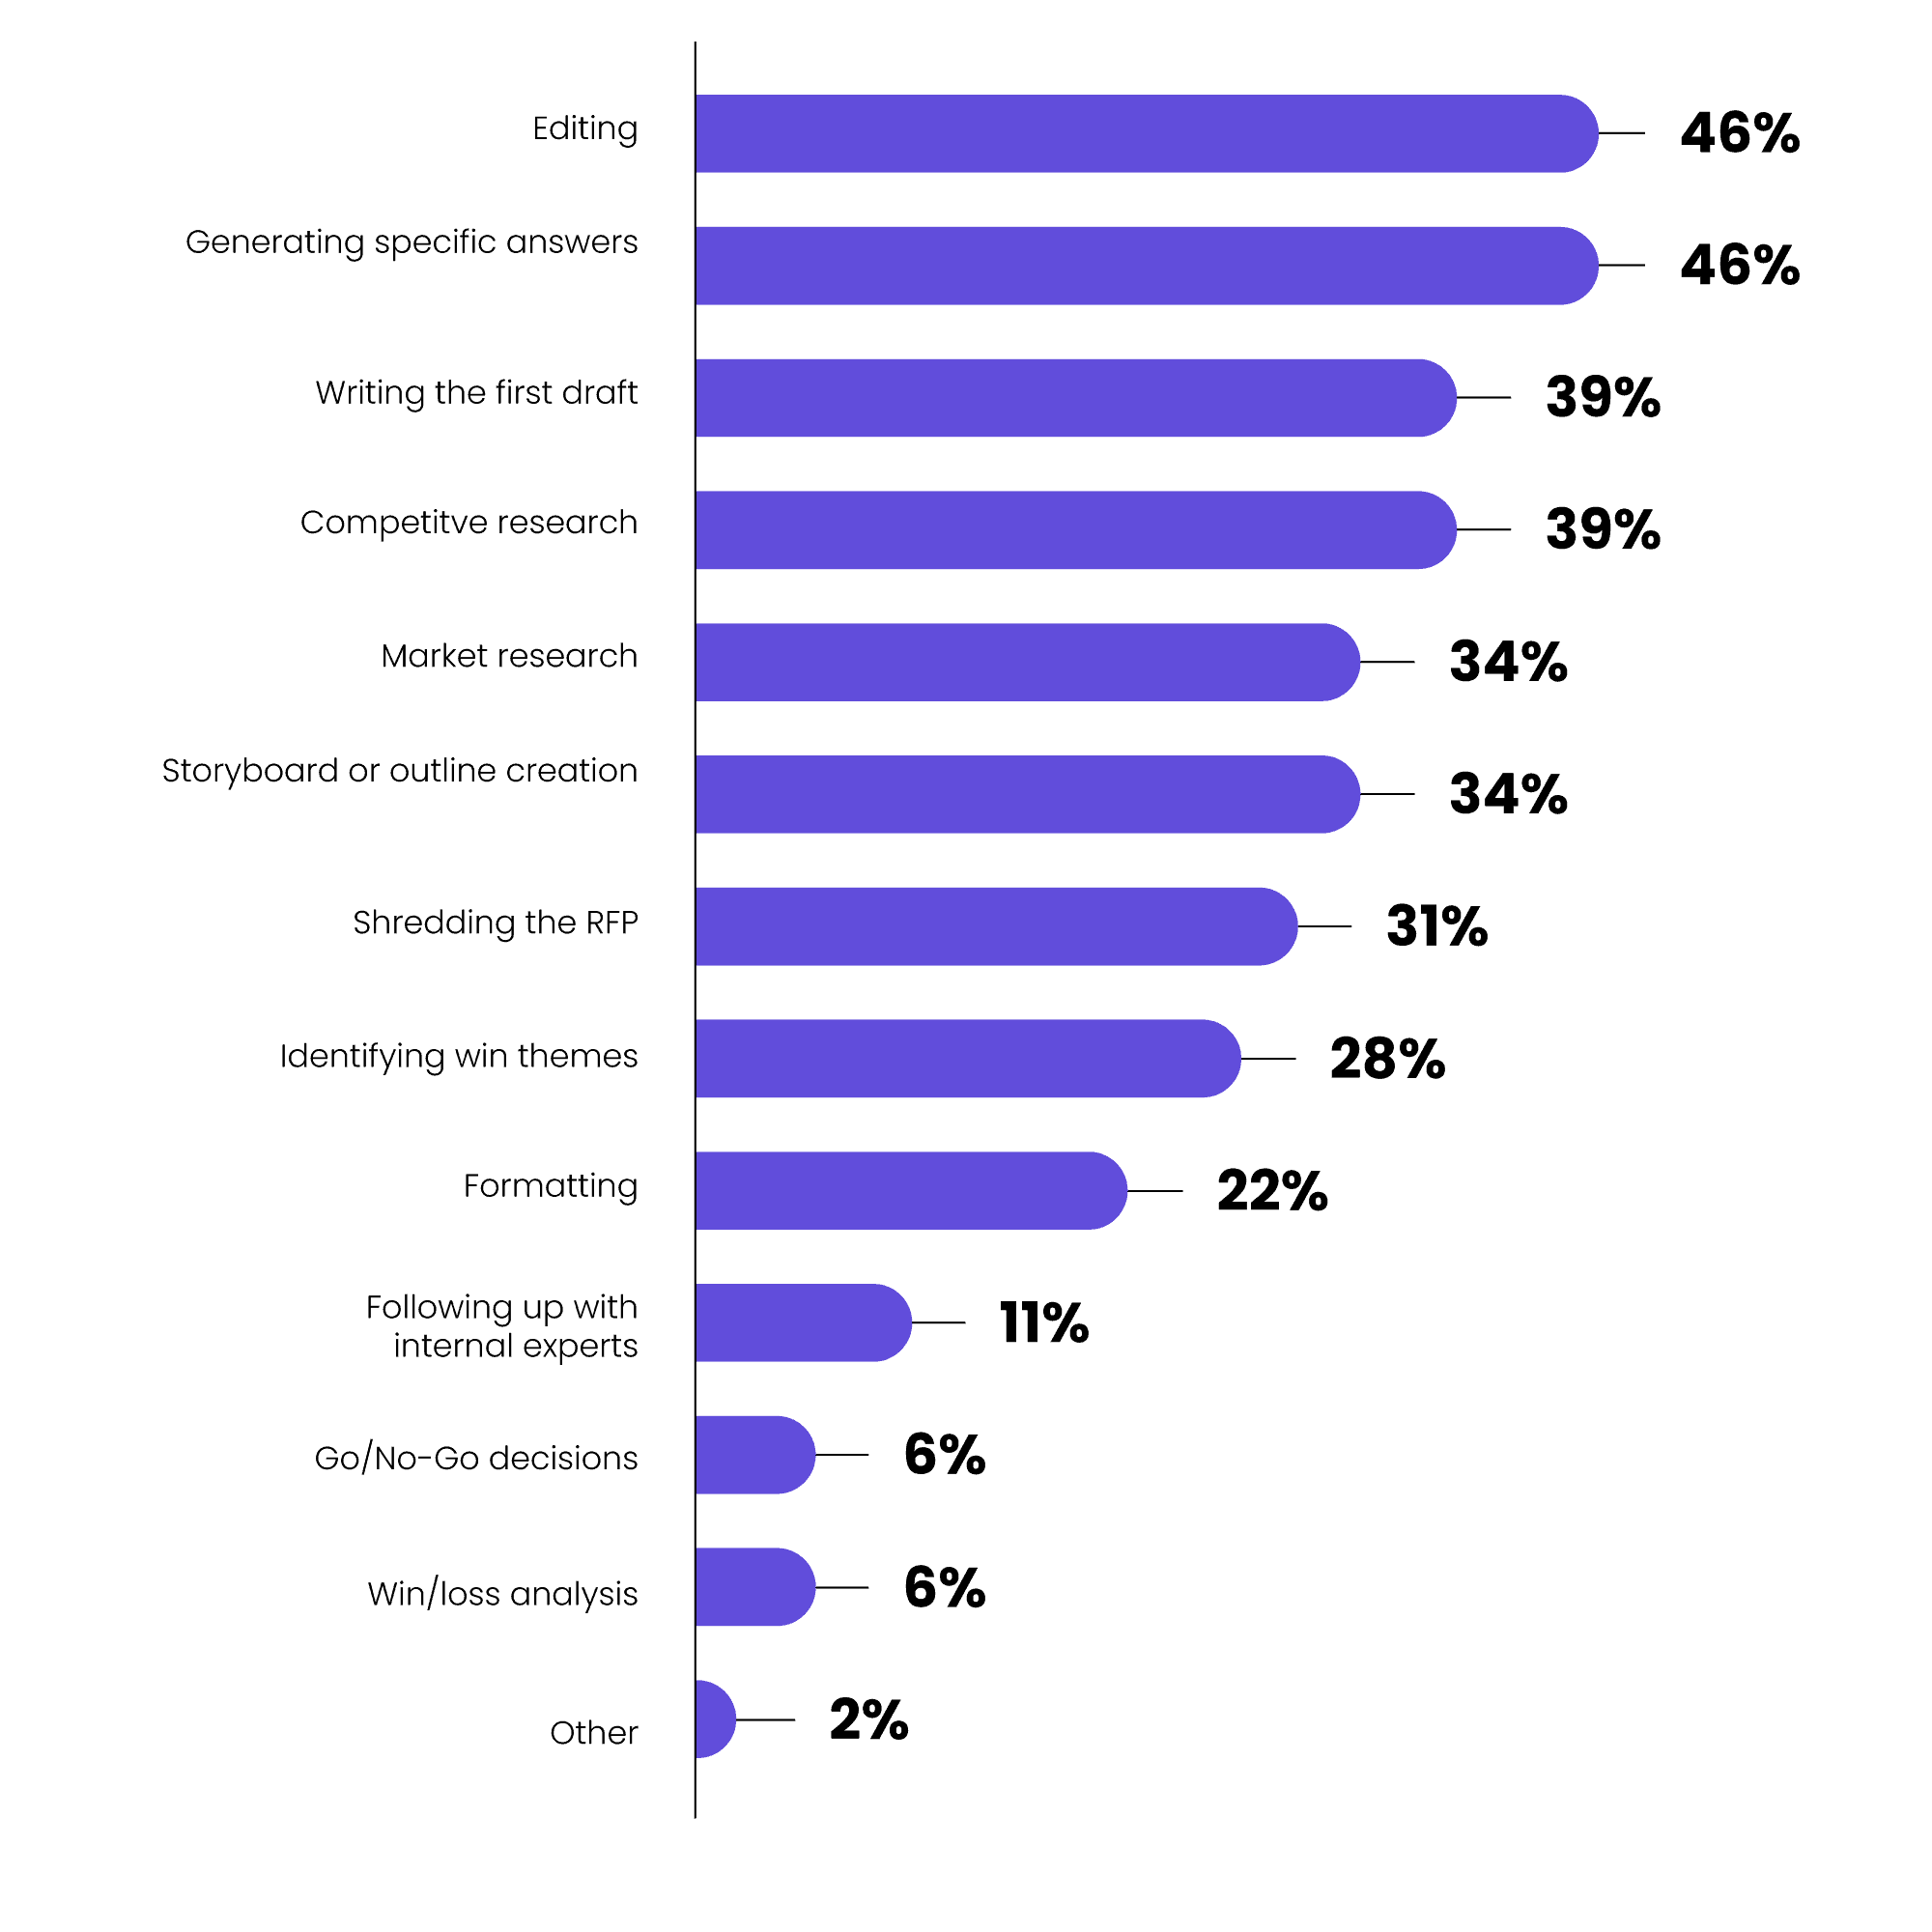
43. Nearly half of teams use AI to generate answers or edit responses.
46% of teams are using AI to generate specific answers and to edit their responses. Other top use cases include writing the first draft, conducting competitive research or market research, and storyboarding.
2025 RFP Resources and Predictions
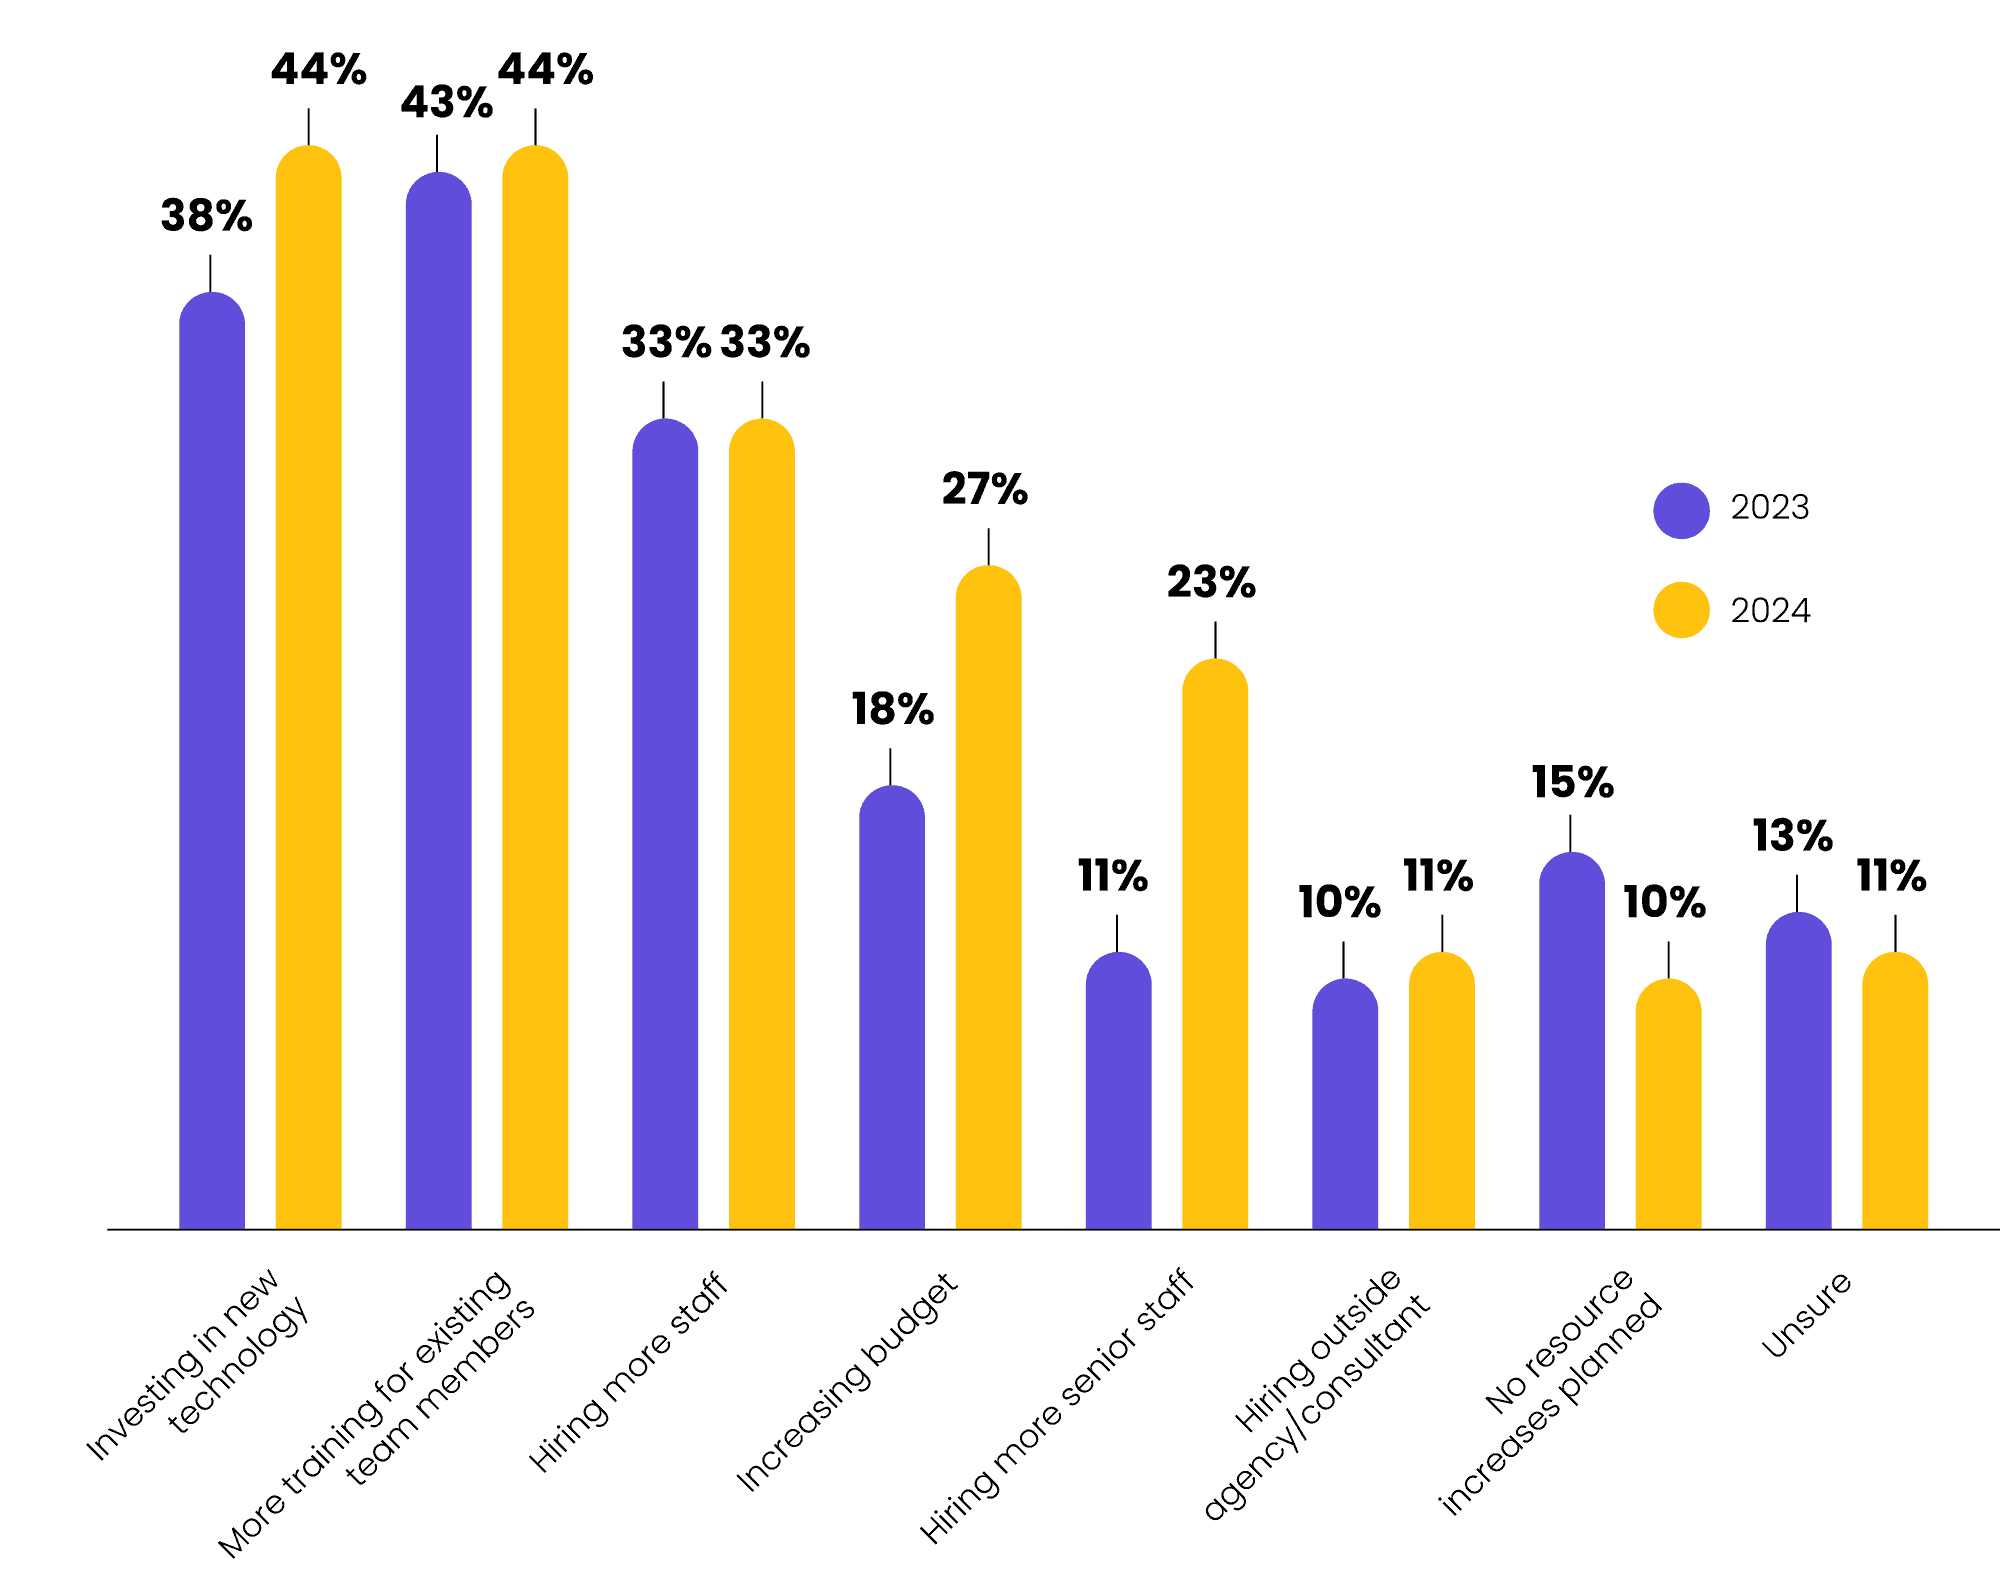
44. Companies plan to invest even in new technology and team training.
In 2025, 44% of teams plan to invest in new technology and team training—making them the top priorities. Interest in both areas of investment has grown since last year, rising from 38% and 43%, respectively.
45. 61% of organizations intend to submit more RFPs in 2025.
With greater confidence in their resources, over 60% of respondents plan to increase their RFP submission volume in 2025—a big jump from last year’s 49%.
46. Teams see faster SME responses and stronger content management as the keys to winning more RFPs.
When asked how their company could win more RFPs in 2025, respondents pointed to faster SME responses (33%), better content management (31%), and a smoother overall process (30%). These top recommendations mirror last year’s, reinforcing that teams still see these as the key to success.
The last point comes as no surprise–whether you’re learning how to respond to a government RFP, or increasing your volume of private sector submissions, having an efficient RFP response process is critical to closing new business faster.
Note: This article is updated annually to reflect new research and RFP statistics.