2023 RFP Trends & Benchmarks
Chapter 1: Economic Impact On RFP Volume & Submissions
Submission volume grows despite an uncertain year.
Qualification trends continue to rise.
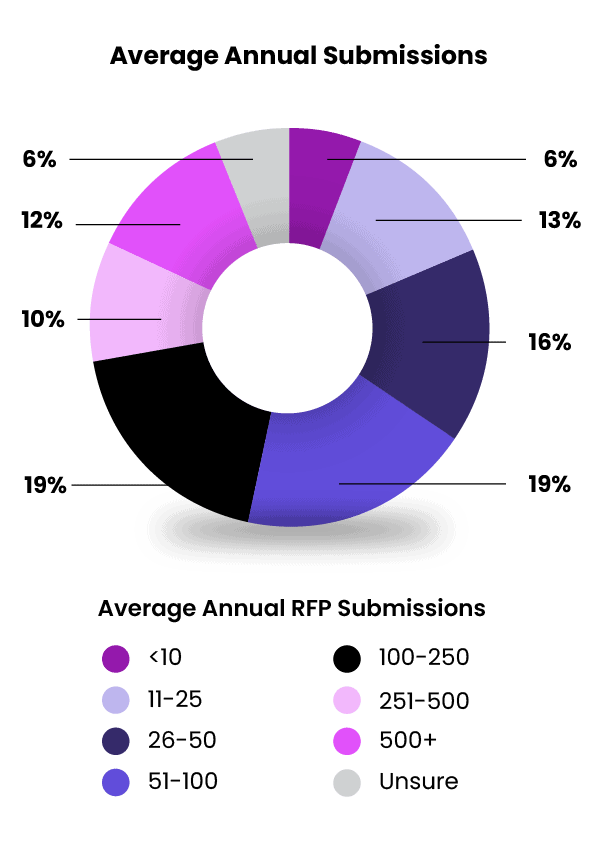
Companies replied to an average of 162 RFPs this year, much more than last year’s average of 137. Looking across the full distribution of bid volume, the top 20% of teams submit 250+ bids annually, while the lowest 20% submit less than 25.
The average number of RFPs submitted annually.
147
RFPs
2019
150
RFPs
2020
137
RFPs
2021
162
RFPs
2022
Although the overall average this year is significantly higher than the year before, this is influenced by the influx of APMP members (who made up 50% of this year’s sample). On average, APMP members submit 189 bids annually, in comparison to non-members who submit an average of 139.
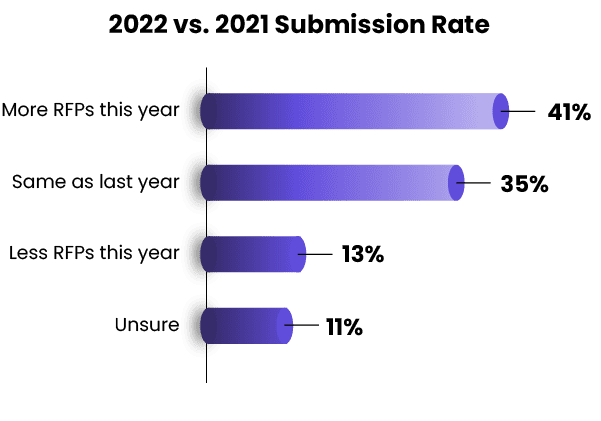
Economic Impact: 76% of Teams See No Dip in Volume
Despite the economic peaks and valleys of the past year, the majority of teams (76%) submitted the same or an increased number of RFPs over the last year.
Rise of Go/No-Go Continues, Adopted by 80% on Average
The past few years have seen qualification trends continue for RFPs. Most responders use a go/no-go process to decide which RFPs to pursue: 80% this year, up from 76% last year, and 72% the year before.

Industry Insight: Financial Services Responds To The Most RFx
Annual submissions do vary widely by industry with Financial Services responding to the highest volume (217) out of all groups. Non-profit/Government responded to the least (132).

It’s important to note, especially when it comes to the Financial Services Industry, there’s a wide variety of complex documents they respond to. While RFIs take the top spot, RFPs closely follow, as well as proactive proposals.

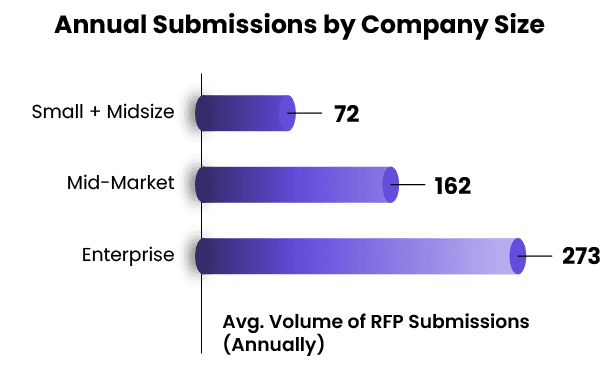
Enterprise Companies Respond To 3.8x More RFPs
Perhaps unsurprisingly, enterprise companies submit nearly 4x the number of RFPs (and other complex documents) as Small & Midsize firms. This is likely because larger companies are more likely to have RFPs as part of their sales cycle, since enterprise companies tend to sell to big, complex organizations that require more standardized, formal processes.
Key Insight: Enterprises Least Satisfied With Go/No-Go Adoption
Enterprise companies are the most likely to have implemented a go/no-go process (84% have one), but also the least likely to be satisfied with it. Overall, companies with 5001+ employees rated their satisfaction with their team’s adherence to a go/no-go at 3.1 out of 5 (essentially, neutral). The team size likely has something to do with this lack of satisfaction—the more people involved, the more difficult it is to get everyone on the same page.
Chapter Summary: Submission Growth Increases, Alongside Qualification
Companies have seen growth than decline in terms of submission volume this year. And despite economic factors, teams still seem heavily focused on qualifying RFP opportunities before participating, as go/no-go trends are also on the rise.
That said, even though the vast majority of companies now use some kind of go/no-go process, the many are feeling neutral about how well it is followed. Clearly, it’s not just enough to implement a go/no-go process—you have to get your team to use it, too.
Up next: In spite of economic turbulence, win rates have remained constant—and RFP revenue has increased.
Download The Full Report
Get more best practices and trends to guide your team in 2023.